There are no articles in this category. If subcategories display on this page, they may have articles.
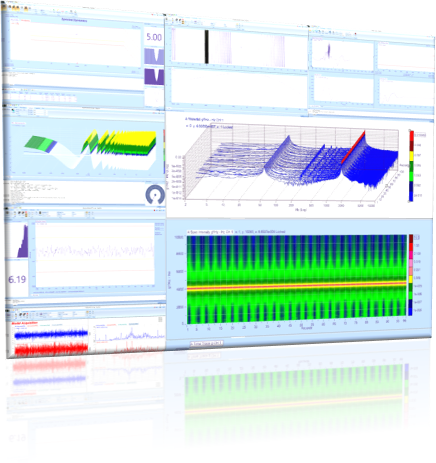
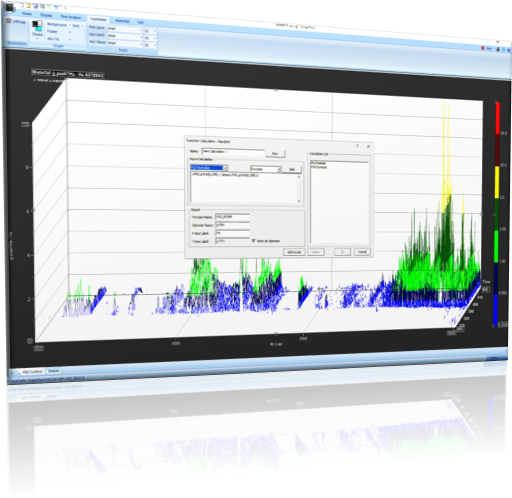
Plot Types
A wide range of 2D, 3D and intensity plots are available across all applications.

Bode

Campbell

Composite Plot

FFT Phase

Frequency Track
 Mag")
H(f) Mag

Lin Spec

Mag Spec

Order Track

PSD

Sine

Spec Intensity

Statistics

Synth Octave

Time Trace

Waterfall

X-Y
Supported function types include
|
|
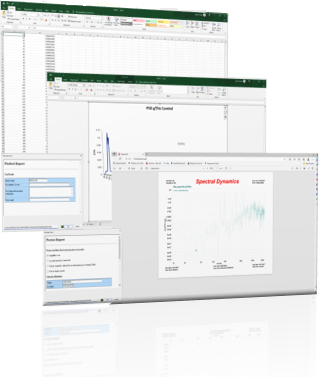
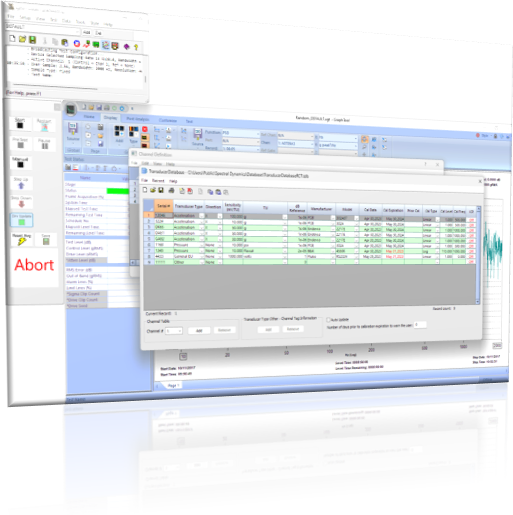
One Click Report Generation
A simple mouse click will export the current display to a variety of different formats

Word
Exports all current pages of GTX into Microsoft Word. Each page of GTX will be exported as its own image.

Excel
Exports the currently selected plot as XY values and creates a graphical plot in Microsoft Excel as well.

Clipboard
Allows either the XY values of the plot (text format) or the image to be copied to the Windows Clipboard.

Exports all current pages of GTX into a PDF (Adobe Portable Document Format).

Image
Exports the current page to an image file. Supported formats are PNG, JPG and BMP.
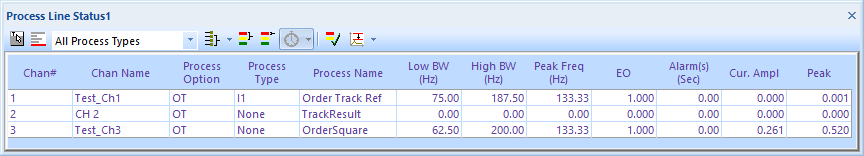
Status Panels
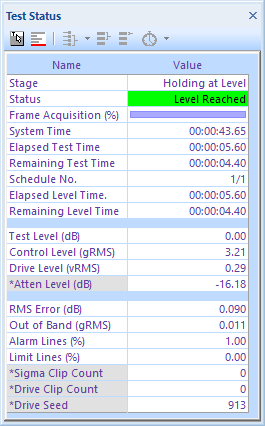
The Process Line Status panel presents the numerical results of the Process Line Definition calculations in tabular format. The content of the status rows reflects the conditions of the Warning and Alarm levels as well.
Custom Status Panels
The custom status panels can display processed data in a multitude of ways and from a variety of sources, all defined by the end user.

Custom Status Panels
The displays can present data over a customizable range of time, up to and including the most recent 10 minutes of data.

Different Display Modes
Text, X-Y graphs, bar graphs, gauges, and tachometers can be used.

User Pane Setup
Panes are organized into rows and columns and are fully customizable. Above is a status panel consisting of 8 rows by 5 columns resulting in 40 plots.
![]()
![]()
![]()