Panther – Field Data Vibration Test Replication Software
Panther Field Data Replication Control delivers precision and performance in time-domain waveform...
The PANTHER Calculator is a powerful, integrated data manipulation and analysis tool within the GTX (GraphToolX) software environment that enables vibration test engineers to perform sophisticated real-time and post-test data processing operations. As a core component of the PANTHER vibration control system from Spectral Dynamics, the Calculator provides comprehensive capabilities for normalizing vibration test data, calculating control errors, performing time-domain calculations, creating custom mathematical operations, and generating derived measurements essential for vibration testing analysis, quality control, and engineering validation across random vibration testing, sine vibration testing, shock testing, and modal analysis applications.

The PANTHER Calculator operates seamlessly on multiple data types including stored vibration test data files (.SDD format), live acquisition data during active testing, and time stream (.STX) recordings. This versatility enables vibration test engineers to perform data manipulation and analysis at any stage of the testing workflow—from real-time test monitoring through comprehensive post-test analysis. The Calculator's integration within GTX eliminates the need for external data processing tools, streamlining vibration testing workflows and improving productivity in automotive testing, aerospace testing, electronics qualification, and structural dynamics analysis applications.
Vibration test engineers use PANTHER Calculator to process measurement data from electrodynamic shakers, hydraulic shakers, multi-axis test systems, and modal testing configurations. The Calculator handles frequency-domain data including Power Spectral Density (PSD), magnitude spectra, frequency response functions, and coherence measurements, as well as time-domain data including acceleration time histories, velocity waveforms, displacement traces, and transient capture recordings. This comprehensive data handling capability makes the Calculator essential for modern vibration testing laboratories performing component qualification, durability testing, resonance identification, and dynamic characterization.
PSD normalization in vibration testing divides Power Spectral Density data by maximum PSD values, enabling direct comparison of random vibration tests with different overall levels. This vibration test data manipulation is particularly useful when comparing test profiles across different amplitude scales or validating consistency between multiple test runs. PANTHER Calculator implements PSD normalization using the formula: <PSD,g²/Hz[X,Off]> / max(<PSD,g²/Hz[X,Off]>), where X represents any channel and the calculation automatically identifies the maximum PSD value across the entire frequency spectrum.
Vibration test engineers apply PSD normalization when comparing random vibration profiles from different shaker systems, validating test repeatability across multiple runs, assessing environmental testing consistency, comparing measured vibration to normalized specifications, and generating normalized test reports for quality documentation. The normalized PSD displays in standard GTX graph formats showing relative spectral content independent of overall test amplitude, facilitating objective comparison of random vibration test characteristics and spectral distribution.

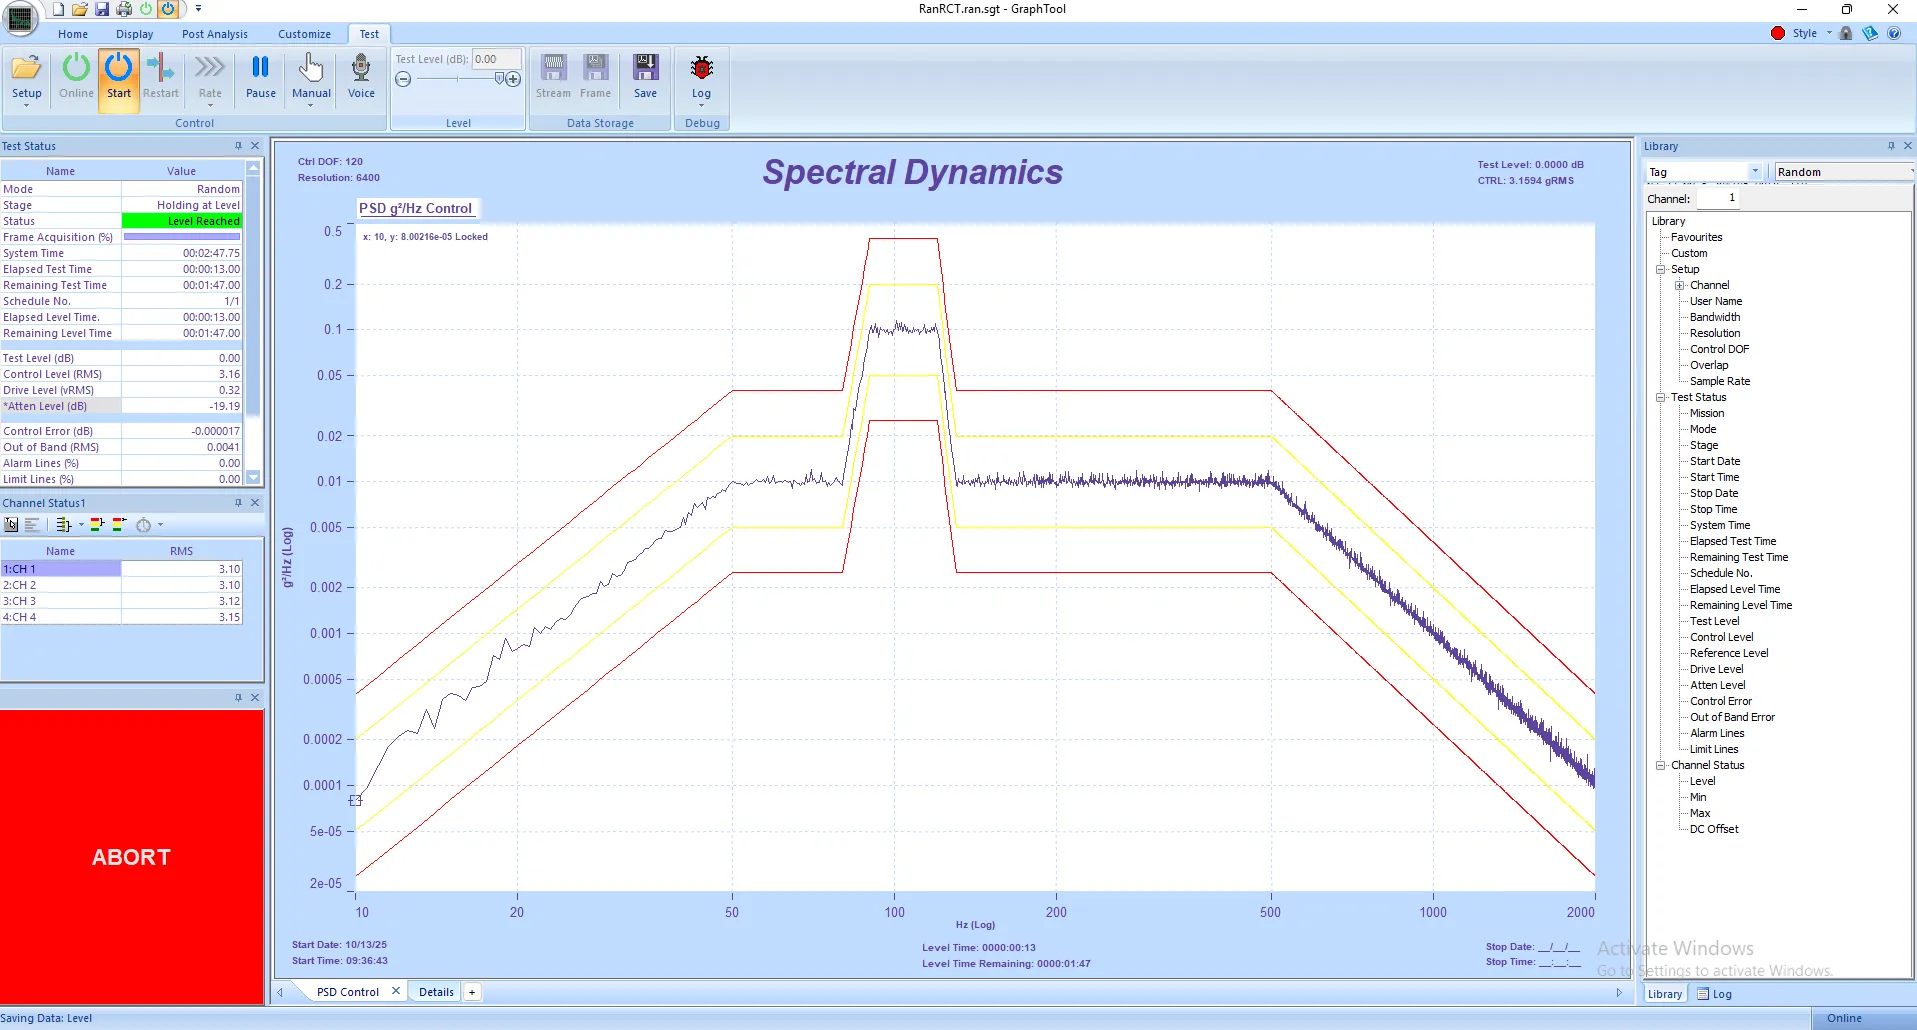
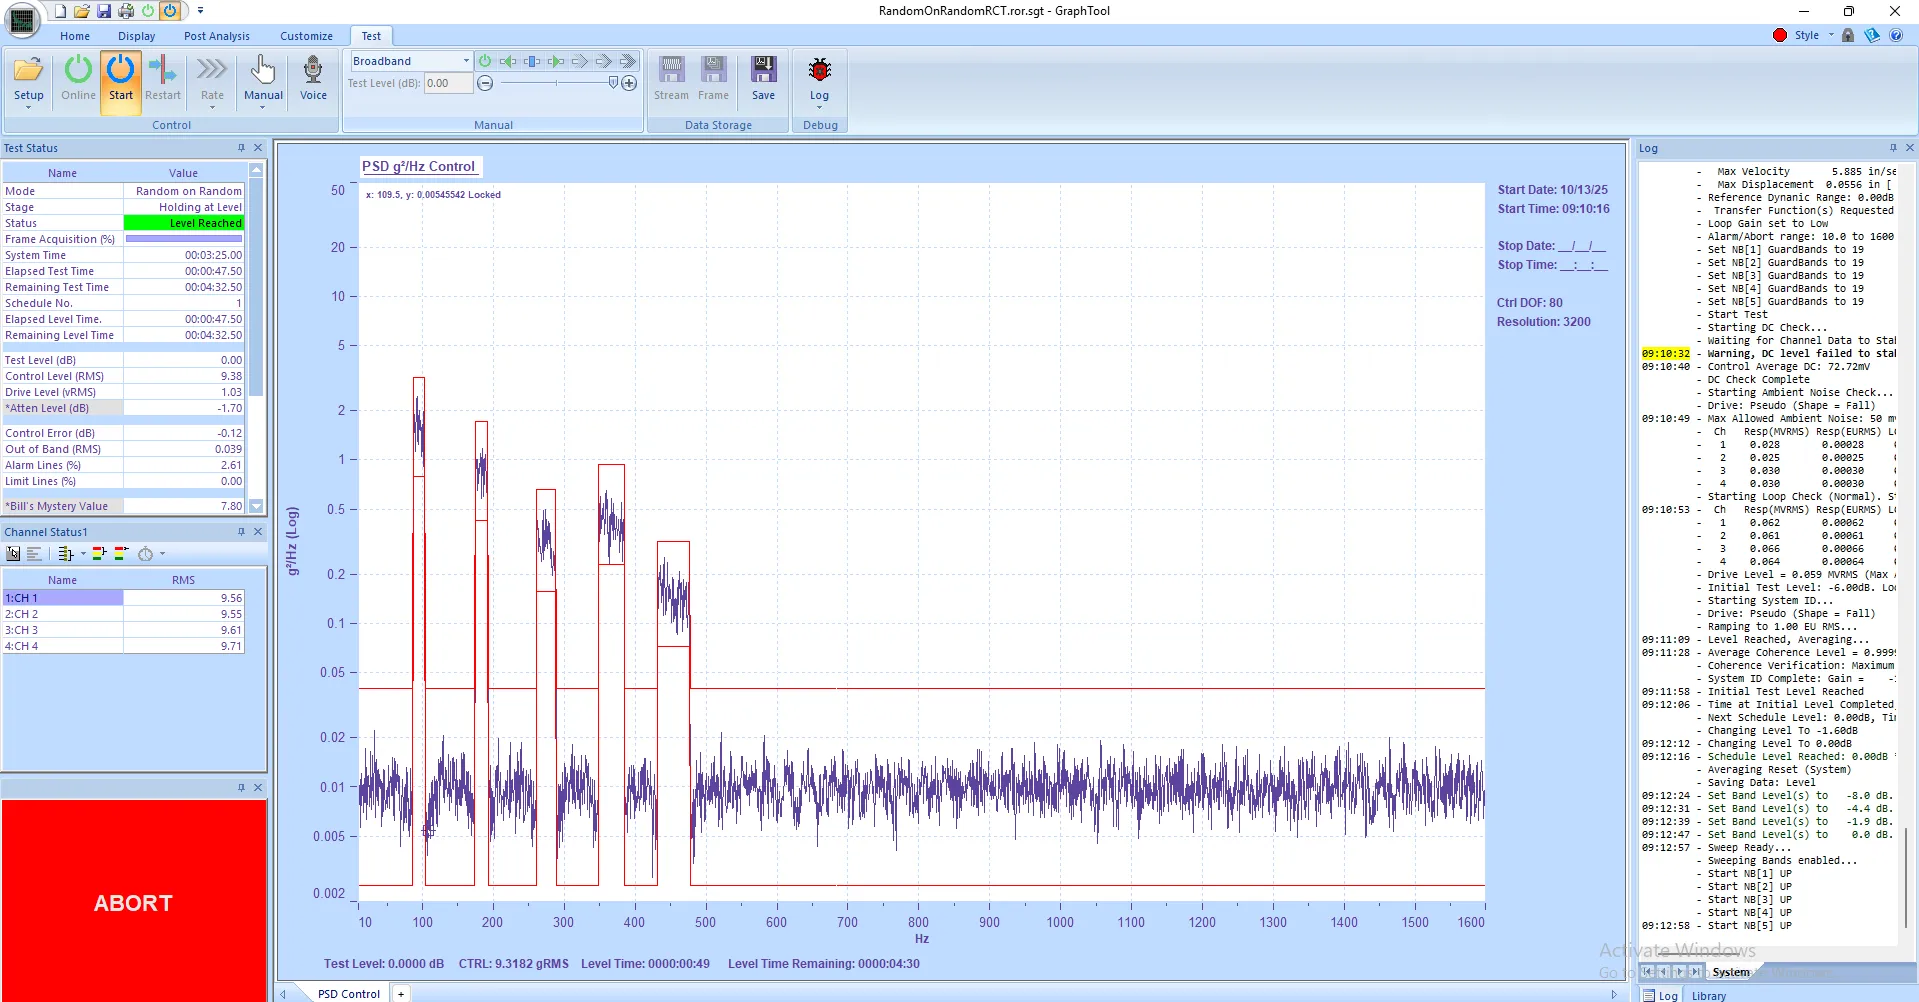
Control error calculations in vibration testing determine the difference between reference signals and measured responses in decibels, providing quantitative assessment of vibration control accuracy. PANTHER Calculator computes control error using the formula: (10 * $log10(<PSD,g²/Hz[X,Off]> / <PSD,g²/Hz[Reference,Off]>)), generating decibel-scale representations of control accuracy across the frequency spectrum. Control error calculations are crucial for verifying closed-loop control performance and identifying frequency regions where control quality may be degraded due to shaker dynamics, fixture resonances, or test article nonlinearities.
Vibration test laboratories use control error calculations to validate that measured vibration matches specified test profiles within tolerance bands, identify frequency regions requiring notching or equalization compensation, assess control system performance during long-duration durability testing, document test quality for qualification testing reports, and troubleshoot vibration control issues during test development. The Calculator displays control error in real-time during active testing or from stored data during post-test analysis, enabling immediate identification of control quality issues and proactive test management.
Time-domain calculations in PANTHER Calculator perform mathematical operations on time trace channels including subtraction, addition, multiplication, and division. Time-domain calculations enable differential measurements between control and response channels, signal scaling for unit conversions, custom derived channels for specialized vibration testing applications, and temporal correlation analysis between multiple measurement points. Vibration test engineers create time-domain calculations to compute relative displacements between fixtures and test articles, determine acceleration differences for structural dynamics analysis, scale time traces for visualization purposes, and derive velocity or displacement from acceleration measurements.
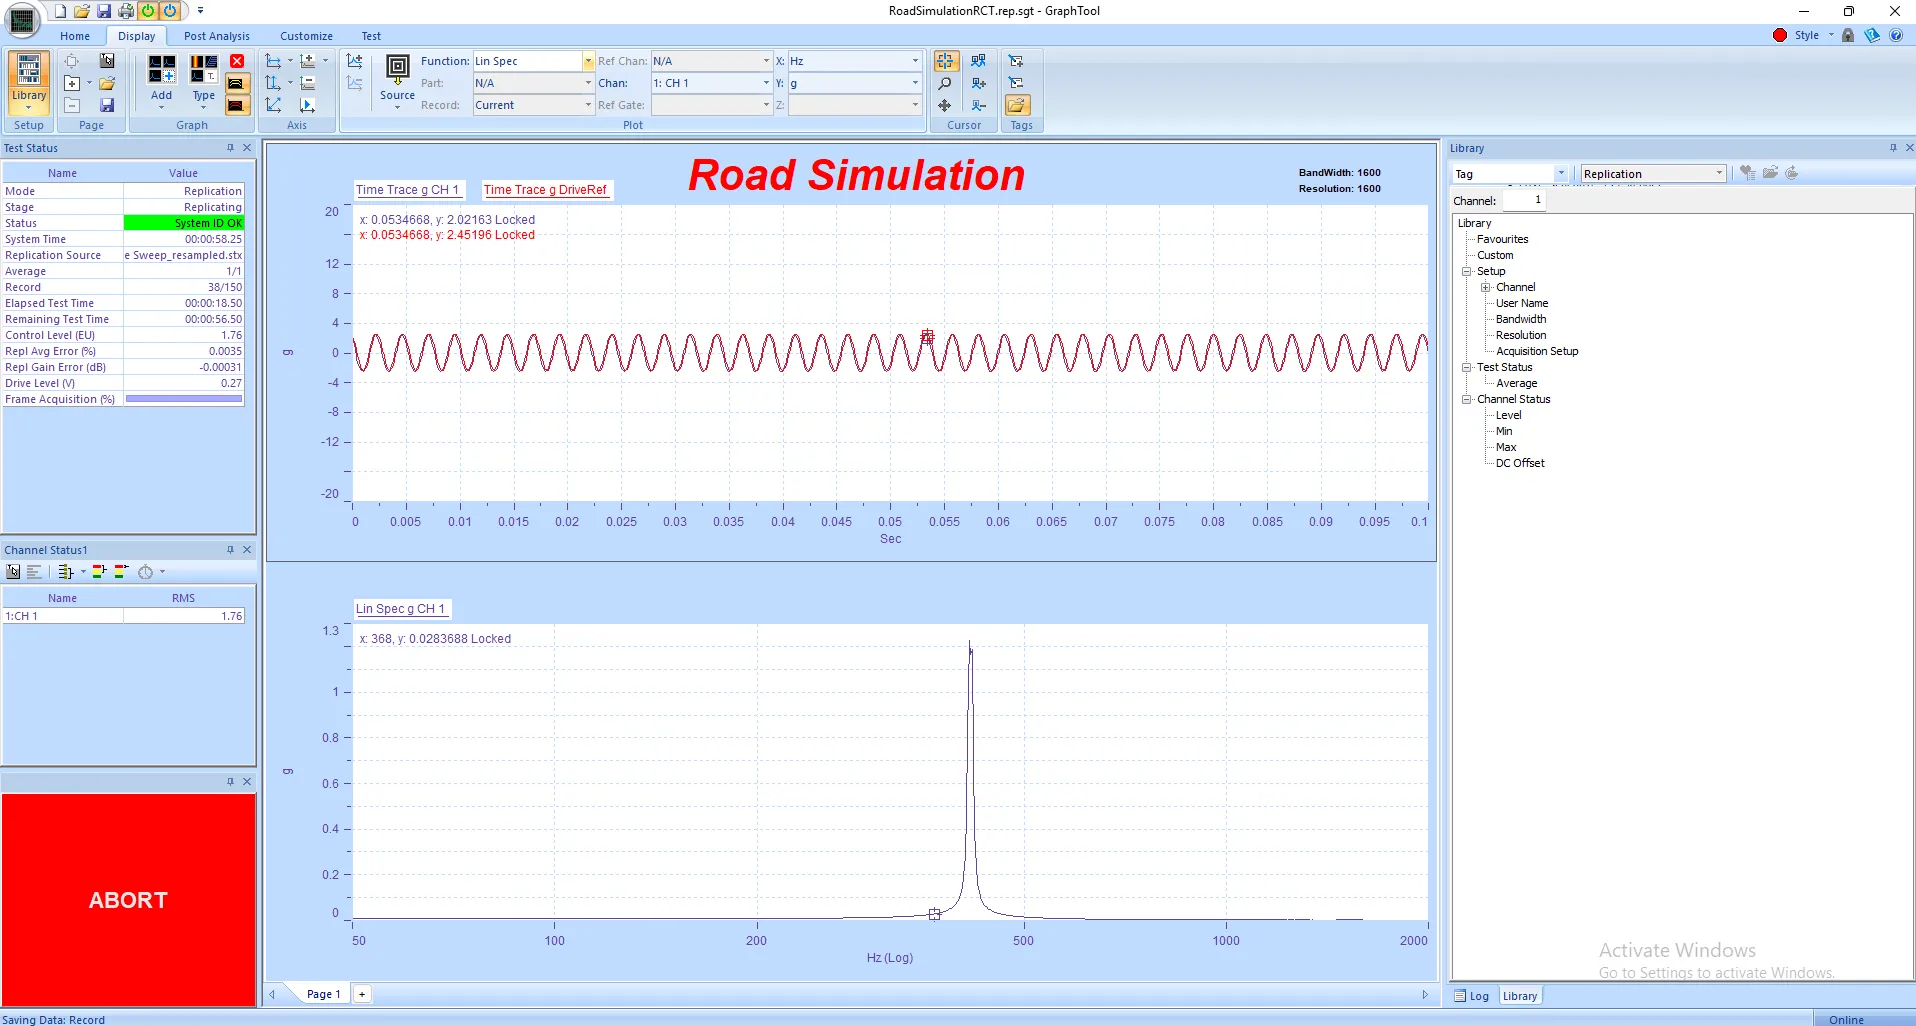
PANTHER Calculator processes time-domain data from transient capture recordings, shock pulse measurements, road simulation testing, and continuous monitoring applications. Time-domain calculations apply to single events or extended duration recordings, maintaining complete synchronization across all channels and preserving timing accuracy essential for phase-sensitive measurements. The Calculator's time-domain capabilities complement frequency-domain processing, providing comprehensive analysis tools for both steady-state vibration testing and transient shock testing applications.
Custom mathematical operations in PANTHER Calculator enable vibration test engineers to define user-specific calculations using standard mathematical operators and functions including logarithms, trigonometric functions, square roots, and exponentials. Custom calculations enable specialized analysis tailored to specific vibration testing requirements including unit conversions, derived measurements, composite parameters, and application-specific quality metrics not available in default calculation sets. Engineers create custom calculations for computing RMS values from PSD spectra, calculating transmissibility ratios, determining Q-factors from resonance peaks, and deriving vibration dose values for structural health monitoring.
The custom calculation capability supports complex expressions combining multiple operations, conditional logic, and multi-channel inputs. Vibration test engineers define calculations once and apply them repeatedly across different test programs, different test articles, and different measurement channels, ensuring consistent analysis methodology and standardized data processing across vibration testing laboratories. Custom calculations save to GTX calculator libraries for sharing across engineering teams and archiving with test documentation for long-term repeatability and traceability.
Multi-channel operations in PANTHER Calculator apply calculations across single channels or multiple channels simultaneously using variable channel designation (X notation). Multi-channel operations streamline repetitive calculations and ensure consistent processing across all measurement channels in multi-axis testing, structural dynamics analysis, and simultaneous multi-point monitoring applications. The Calculator's channel variable system enables universal calculations applicable to any channel without requiring separate calculation definitions for each measurement point, dramatically reducing setup time and ensuring uniform data processing methodology.
Vibration test engineers use multi-channel operations to process data from 8-channel, 16-channel, or 32-channel PANTHER systems simultaneously, apply consistent normalization across all response accelerometers, compute weighted averages for multi-axis control strategies, and generate derived measurements for all monitoring channels. The multi-channel capability scales efficiently from simple component testing with few channels to complex structural testing with dozens of simultaneous measurement points, maintaining calculation performance and real-time processing capability regardless of channel count.
Real-time processing in PANTHER Calculator executes calculations on live data during active vibration testing, providing immediate derived measurements and calculated parameters. Real-time processing enables dynamic test monitoring and adaptive test control based on derived measurements rather than only raw sensor signals. Vibration test engineers monitor control errors, normalized PSDs, weighted averages, and custom calculations as tests run, enabling immediate assessment of test quality and control performance without requiring post-test processing delays.
Real-time calculation capability is essential for long-duration durability testing where test quality must be continuously validated, qualification testing where acceptance criteria depend on derived parameters, and development testing where engineers need immediate feedback on test article response characteristics. The Calculator processes live data with minimal latency, displaying calculated results in GTX graphs with update rates matching the underlying data acquisition system, typically 10-25 updates per second depending on application and processing complexity.
PANTHER Calculator seamlessly integrates with stored vibration test data files (.SDD format) containing frame-based measurement data from completed tests. To begin using Calculator with stored data, vibration test engineers first open the desired .SDD file using the Display tab under Plot > Source navigation in GTX. Once the data file loads into GTX, the Calculator becomes immediately available for performing calculations on stored vibration test data including PSD spectra from random testing, sine sweep measurements, shock pulse recordings, and frequency response functions from modal analysis.
Stored data file processing enables comprehensive post-test analysis without requiring shaker operation or test article availability. Engineers apply multiple calculations to the same stored data, compare calculated results across different test runs, generate derived measurements for documentation and reporting, and validate test quality against acceptance criteria. The Calculator processes stored data files from any PANTHER application including Random vibration control, Sine vibration control, Shock testing, Transient Capture, and Rotating Machinery Analysis, providing unified data processing capability across all vibration testing modes.
Each PANTHER application includes factory-defined default calculations optimized for that specific testing mode. These default calculations provide immediate access to commonly-used data processing operations without requiring custom calculation setup. For Random vibration testing, PANTHER Calculator provides four pre-configured calculations addressing typical random vibration analysis requirements:
Syntax: <PSD,g²/Hz[X,Off]> / max(<PSD,g²/Hz[X,Off]>)
The PSD Normalize calculation divides each frequency line by the maximum PSD value across the entire spectrum, generating normalized PSD data with peak value of 1.0. This random vibration calculation enables comparison of spectral shapes independent of overall amplitude, validation of test profile consistency across different amplitude levels, and generation of normalized reference profiles for specifications. Vibration test engineers apply PSD normalization when comparing environmental testing profiles, validating shaker performance across different drive levels, and documenting spectral characteristics in test reports.
Syntax: (((<PSD,g²/Hz[1,Off]>*3) + (<PSD,g²/Hz[2,Off]>*1)) / 4)
The PSD Weighted Average calculation computes weighted average of PSD data from multiple channels using user-defined weighting factors. This multi-channel calculation is essential for multi-axis vibration control strategies where control authority derives from weighted combination of multiple control accelerometers. Vibration test engineers customize weighting factors based on test fixture geometry, test article mounting configuration, and desired vibration uniformity characteristics. Weighted averaging reduces sensitivity to single-point measurement anomalies while maintaining representative control signal for closed-loop vibration control.
Syntax: (10 * $log10(<PSD,g²/Hz[X,Off]> / <PSD,g²/Hz[Reference,Off]>))
The Control Error calculation computes difference in decibels between measured PSD and reference specification, quantifying vibration control accuracy across the frequency spectrum. Positive control error values indicate measured levels exceed specification (over-test), while negative values indicate under-test conditions. Vibration test engineers monitor control error during testing to validate specification compliance, identify frequency regions requiring attention, and document test quality for qualification reports. The decibel scale provides intuitive representation of relative differences spanning wide amplitude ranges typical in vibration testing.
Syntax: (<Time Trace,g[X,Off]> - <Time Trace,g[RX,Off]>)
The Time Channel Difference calculation computes time-domain difference between control channel and response channel, enabling relative motion measurements, differential acceleration analysis, and vibration isolation effectiveness assessment. This time-domain calculation is valuable for evaluating test fixture dynamics, assessing test article mounting compliance, and measuring vibration transmission through isolation systems. The resulting differential time trace displays in GTX showing relative motion or force between measurement points.
PANTHER Calculator uses bracket notation [Channel Number, Reference Channel Number] to specify which measurement channels calculations apply to. This channel notation system provides flexible calculation definition enabling universal calculations applicable across any measurement channel. The designation 'X' represents a variable channel number allowing the same calculation to be applied to any selected channel in the GTX display. The designation 'Off' indicates that no reference channel is used in the calculation, appropriate for single-channel operations like normalization or scaling.
Channel notation examples include [X,Off] for calculations applying to any single channel without reference, [1,2] for calculations comparing channel 1 to channel 2 reference, [X,Reference] for calculations comparing any channel to the designated reference profile, and [1,Off] for calculations specific to channel 1 only. This flexible notation system enables creation of both universal calculations usable with any channel and specific calculations targeting particular measurement points. Vibration test engineers select appropriate channel designation based on calculation purpose and measurement configuration.
Understanding channel notation is essential for effective Calculator use. When defining custom calculations, engineers choose variable designation (X) to maximize calculation reusability across different channels and test configurations. Channel-specific notation applies when calculations require particular channel combinations or when processing historical data with fixed channel assignments. The Calculator automatically validates channel selections ensuring calculations reference valid measurement channels and compatible data types (frequency-domain with frequency-domain, time-domain with time-domain).
Beyond default calculations provided for each vibration testing application, engineers define custom calculations tailored to specific testing requirements. Custom calculations enable specialized data processing, unit conversions, derived measurements, and application-specific analysis operations not available in default calculation sets. The custom calculation capability transforms PANTHER Calculator from a fixed-function tool into a flexible vibration test analysis platform accommodating diverse engineering requirements across automotive testing, aerospace testing, electronics qualification, and research applications.
Access the Calculator by selecting the Home tab in GTX, followed by the Tools section, then clicking the Calculator icon. The Calculator dialog opens displaying existing calculations and providing controls for creating new calculations. The Calculator interface organizes calculations by application type (Random, Sine, Shock, etc.) and provides dropdown menus for selecting calculation types and functions.
Click the 'New' button at the top of the Calculator dialog to initiate custom calculation creation. The Input Calculation type automatically sets to 'Custom' enabling user-defined mathematical expressions. The Calculator dialog updates to display custom calculation configuration options including function selection, operator definition, and result parameter specification.
On the right side of the Custom dropdown, select 'Function' from the list and click 'Add' to open the function selection dialog. This dialog provides access to all available data types including Time Trace, PSD, Magnitude Spectrum, Phase, and other measurement functions. Select the appropriate function type matching the data to be processed (frequency-domain functions for PSD data, time-domain functions for time traces).
Choose 'X' for channel designation to create a universal calculation applicable to any channel. This variable designation maximizes calculation reusability across different measurement channels and test configurations. Set Reference Channel to 'Off' unless the calculation requires comparison to a reference channel. Select the appropriate Function type (e.g., Time Trace, PSD, Magnitude Spectrum) and Operator Name defining the engineering units for input data (g, g²/Hz, V, etc.).
In the calculation window, the selected function appears in angle bracket notation <Function,Units[Channel,Reference]>. Add mathematical operators and values to create the desired calculation. For example, to create a scaling calculation multiplying time trace data by 1000 for unit conversion, add '* 1000' after the function notation. The calculation expression supports standard mathematical operators (+, -, *, /), parentheses for order of operations, and built-in functions (log, sin, cos, sqrt, etc.).
Define the Function Name (the identifier that appears in GTX menus for selecting the calculation), Operator Name (engineering units for the calculated result), X Axis Label (horizontal axis units for graphical display), and Y Axis Label (vertical axis units for graphical display) in the Result section of the dialog. These parameters control how calculated results display in GTX graphs and how the calculation appears in dropdown menus. Use descriptive function names clearly identifying the calculation purpose and units.
Click 'Update in List' to save the new custom calculation to the Calculator library, then click 'OK' to return to GTX. The new calculation immediately becomes available in the Plot > Function dropdown menu for application to any compatible measurement channel. Select the custom calculation from the Function dropdown, choose the desired channel, and GTX displays the calculated result using the defined axis labels and units. Custom calculations persist across GTX sessions and save with test documentation for long-term repeatability.
Consider creating a custom calculation that scales time trace acceleration data by a factor of 1000, useful for converting between measurement units (g to milli-g) or amplifying small signals for visualization. This time-domain scaling calculation demonstrates the basic principles of custom calculation creation applicable to more complex mathematical operations. The calculation expression would be:
<Time Trace,g[X,Off]> * 1000
This vibration test calculation multiplies the time trace data (in g units) from any selected channel (X designation) by 1000, generating a scaled result. To implement this calculation, engineers follow the seven-step process: access Calculator, click New, add Time Trace function with X channel designation, append '* 1000' to the function notation, configure result parameters with Function Name 'TIMEx1000', Operator Name 'milli-g', X Axis Label 'Time (s)', and Y Axis Label 'Acceleration (milli-g)', then save with Update in List and OK.
The resulting custom calculation can be applied to any time trace channel by selecting 'TIMEx1000' in the Plot > Function dropdown. The scaled result displays in real-time during testing or from stored data during post-test analysis, providing immediate visualization of the amplified signal. This same methodology extends to more complex calculations involving multiple operations, trigonometric functions, logarithmic transformations, and multi-channel combinations, demonstrating the flexibility and power of PANTHER Calculator custom calculation capability.
PANTHER Calculator supports comprehensive mathematical operations enabling sophisticated vibration test data processing beyond simple arithmetic. These advanced operations transform Calculator from basic data manipulation tool into powerful vibration analysis platform capable of complex signal processing, statistical analysis, and derived measurement generation. Understanding available mathematical operations enables vibration test engineers to create custom calculations addressing specialized analysis requirements across diverse vibration testing applications.
Basic arithmetic operations including addition (+), subtraction (-), multiplication (*), and division (/) form the foundation of vibration test calculations. These operations enable scaling for unit conversions (multiplying acceleration by 9.81 to convert g to m/s²), offsetting for baseline correction (subtracting DC offset from time traces), combining measurement channels (adding multi-axis components for resultant calculations), and normalizing data (dividing by maximum values). Arithmetic operations apply to both frequency-domain data (PSD, magnitude spectra) and time-domain data (time traces, transient captures) with automatic unit handling ensuring dimensional consistency.
Logarithmic functions including logarithm base 10 ($log10) and natural logarithm enable decibel conversions, logarithmic scaling, and exponential data transformation essential for vibration testing. The $log10 function converts linear amplitude data to decibel scale using 20*log10(amplitude) for displacement/velocity/acceleration or 10*log10(power) for PSD data. Decibel scaling provides intuitive representation of wide dynamic range vibration data spanning multiple orders of magnitude. Logarithmic functions are essential for control error calculations, transmissibility measurements, and frequency response function representation in vibration testing applications.
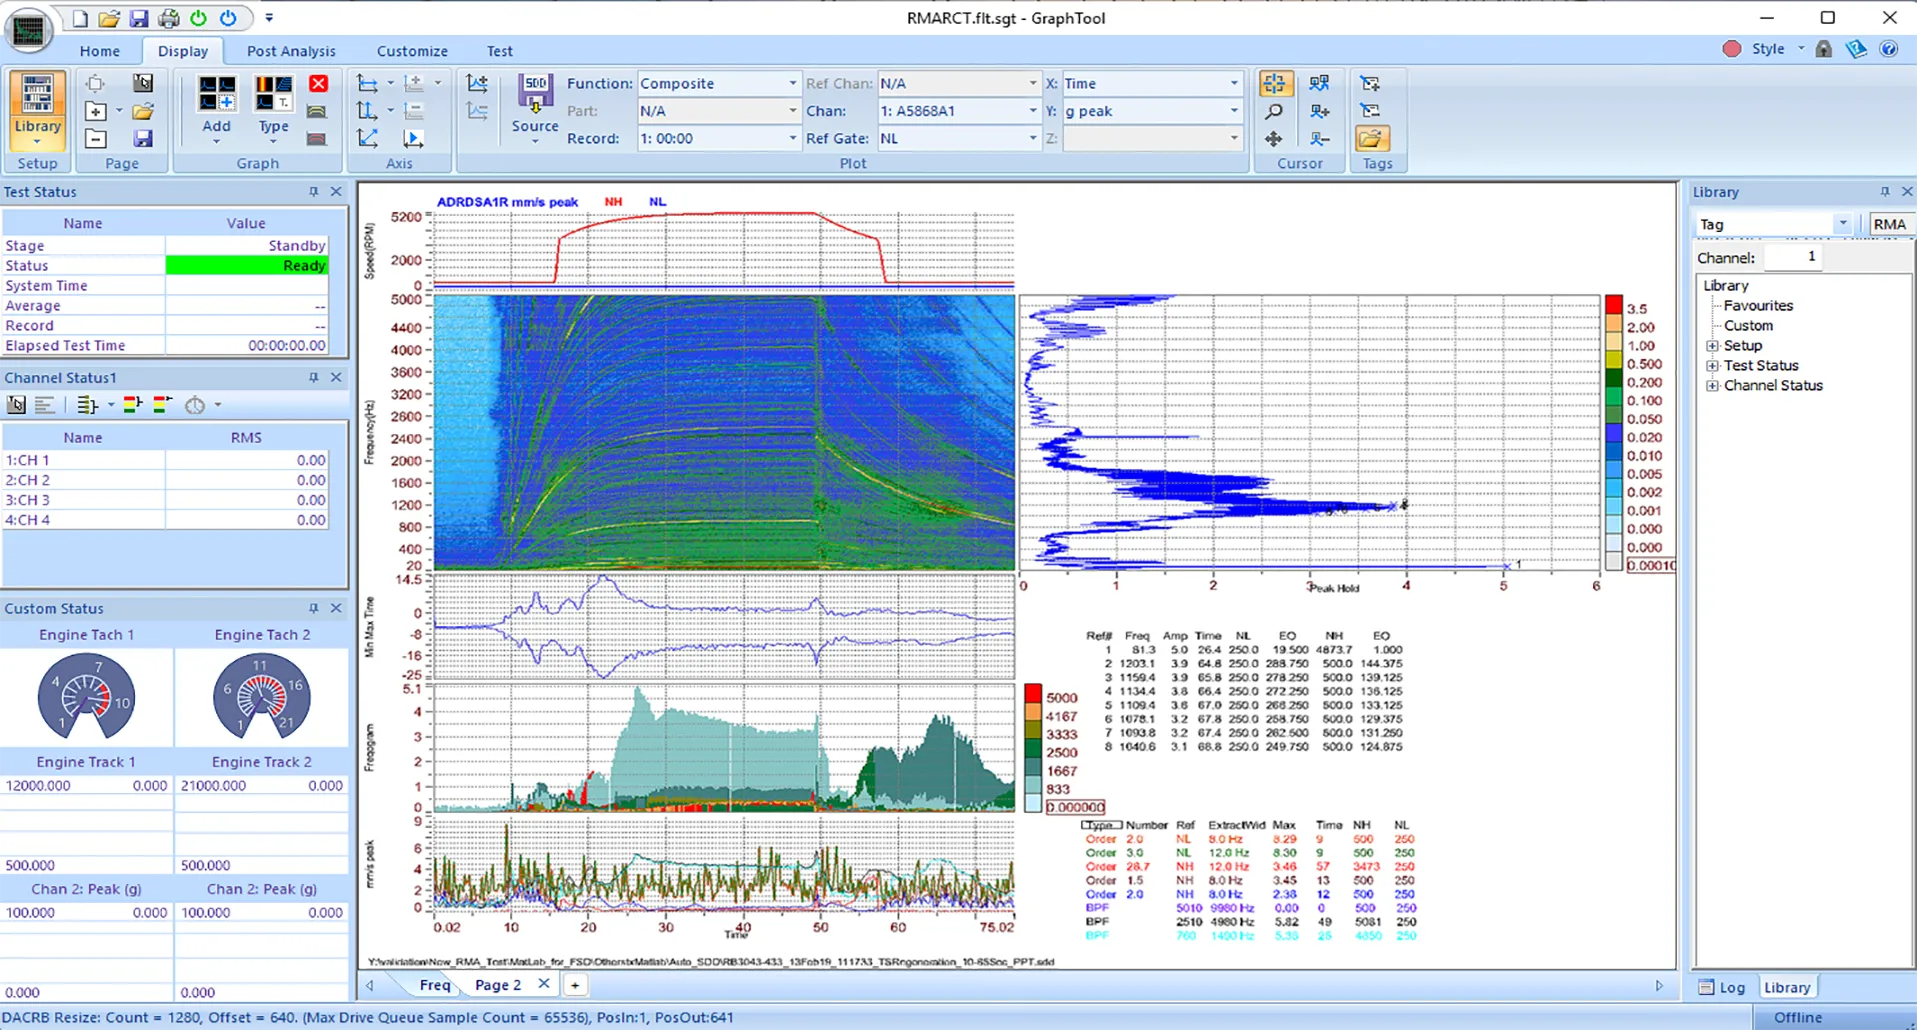
Trigonometric functions including sine (sin), cosine (cos), tangent (tan), and their inverse functions (asin, acos, atan) enable phase calculations, angular measurements, and harmonic analysis in vibration testing. These functions process phase data from frequency response measurements, compute angular relationships in rotating machinery analysis, determine harmonic content in periodic vibrations, and convert between rectangular and polar coordinate representations. Trigonometric operations are particularly valuable in modal analysis for processing complex mode shapes, in rotating machinery analysis for order tracking calculations, and in sine vibration testing for phase-sensitive transfer function measurements.
Square root operations (sqrt) enable RMS calculations, standard deviation computations, and velocity-to-displacement conversions in vibration testing. The square root function converts PSD spectral density to RMS acceleration levels, computes Grms values by integrating PSD spectra, determines standard deviation from variance calculations, and performs velocity integration to displacement using frequency-domain relationships. Root operations combine with integration and summation functions to compute derived vibration parameters including vibration dose values, severity indices, and exposure metrics for structural health monitoring and fatigue analysis applications.
Statistical functions including maximum (max), minimum (min), and average enable identifying peak values, calculating statistical measures, and deriving summary parameters from vibration test data. The max function identifies peak acceleration in time traces, maximum PSD levels in random spectra, and highest response amplitudes in frequency sweeps. The min function determines minimum values for baseline assessment and noise floor characterization. Average functions compute mean values for steady-state measurements, statistical averages for ensemble analysis, and weighted averages for multi-channel combination. These statistical operations integrate with windowing and filtering functions for robust vibration data analysis.
Conditional operations including comparison operators (>, <, ==, !=) and conditional logic enable threshold detection, pass/fail criteria evaluation, and event identification in vibration testing. Conditional operations create alarm conditions based on derived parameters, identify over-level events in continuous monitoring, evaluate specification compliance during testing, and generate quality flags for automated data validation. These operations combine with Boolean logic (AND, OR, NOT) to create complex decision rules supporting automated test execution, real-time quality monitoring, and comprehensive data validation essential for qualification testing and production screening applications.
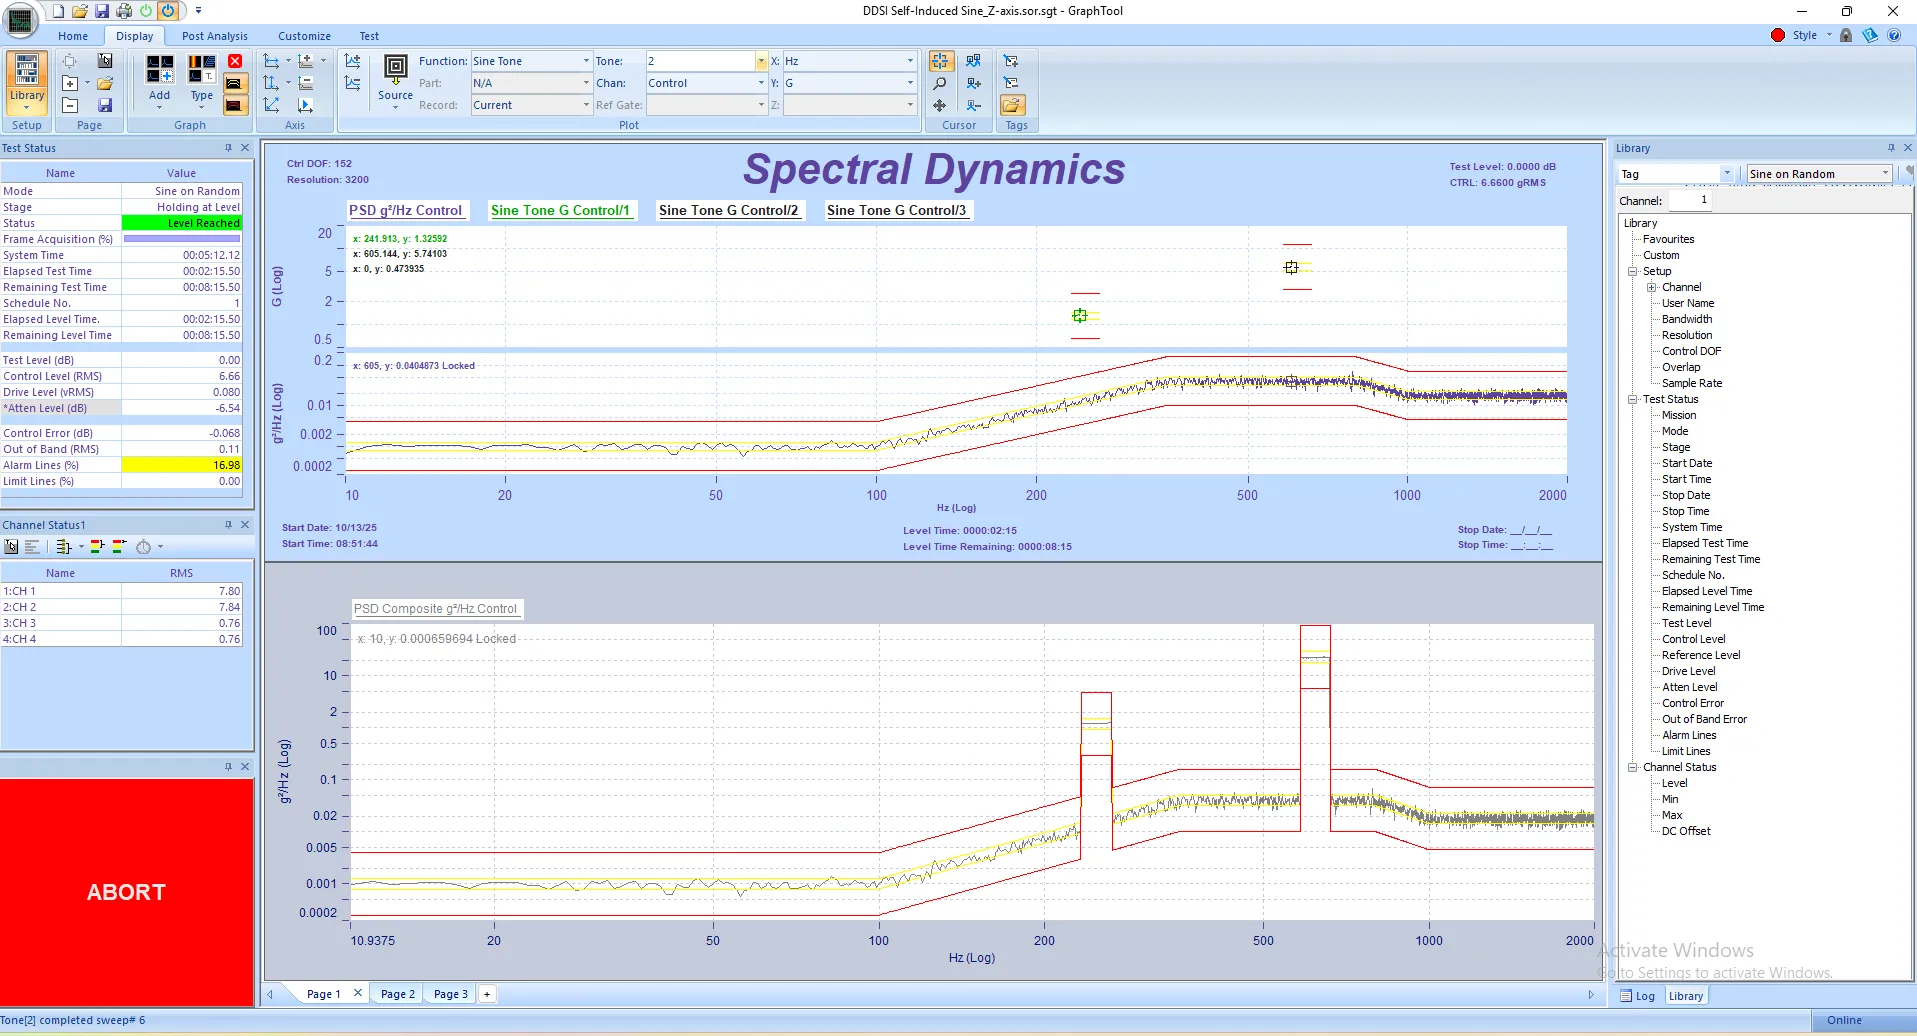
In random vibration testing, PANTHER Calculator normalizes PSD profiles for comparison across different test amplitudes, calculates control errors to assess closed-loop control performance, determines weighted averages for multi-axis control strategies, computes Grms values from PSD spectra for specification compliance, derives kurtosis values for damage potential assessment, and generates statistical parameters for test quality validation. These random vibration calculations support automotive component testing, aerospace qualification testing, electronics durability testing, and transportation simulation applications where random vibration exposure dominates test profiles.
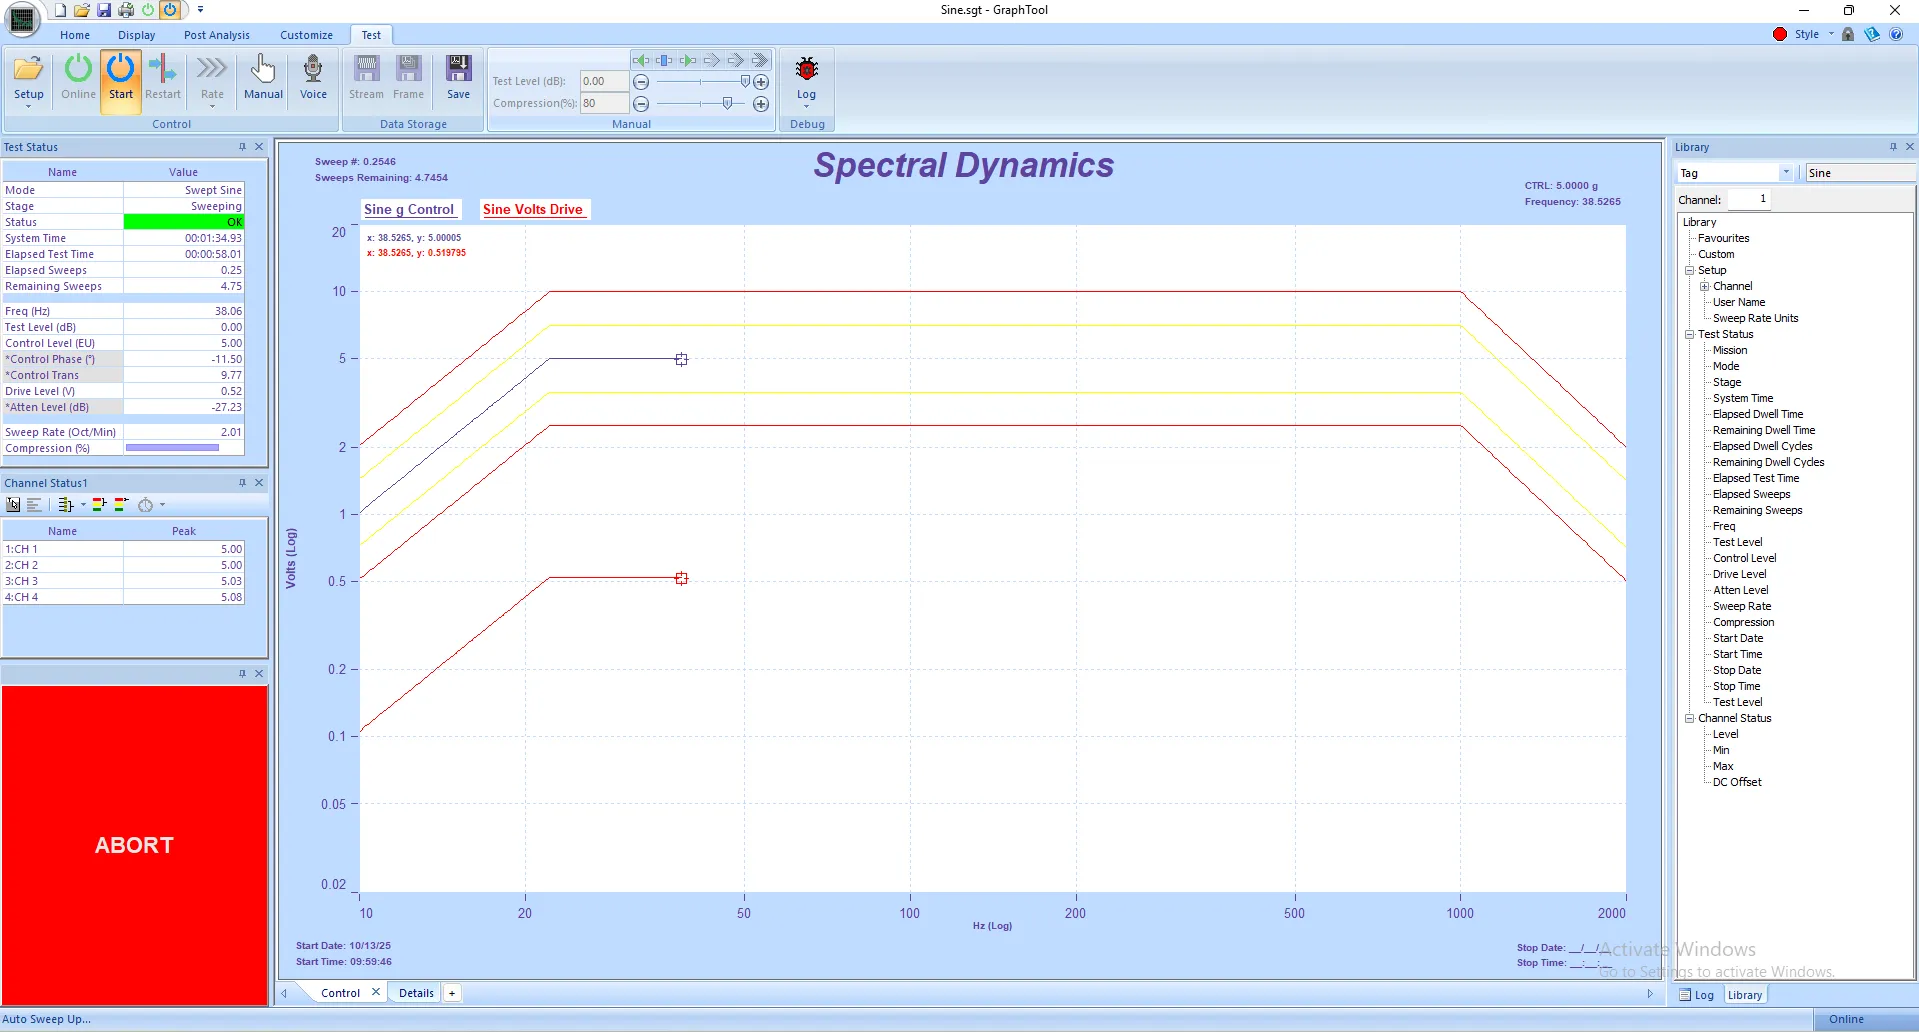
In sine vibration testing, PANTHER Calculator calculates transfer functions by dividing response channel by control channel, determines phase relationships between input and response for resonance characterization, identifies resonance amplification factors (Q-factors) for structural damping assessment, computes transmissibility ratios for fixture characterization and validation, and processes frequency response functions for modal parameter extraction. These sine vibration calculations support resonance search testing, sine dwell testing at critical frequencies, sine sweep testing for transfer function measurement, and stepped sine testing for detailed frequency response characterization.
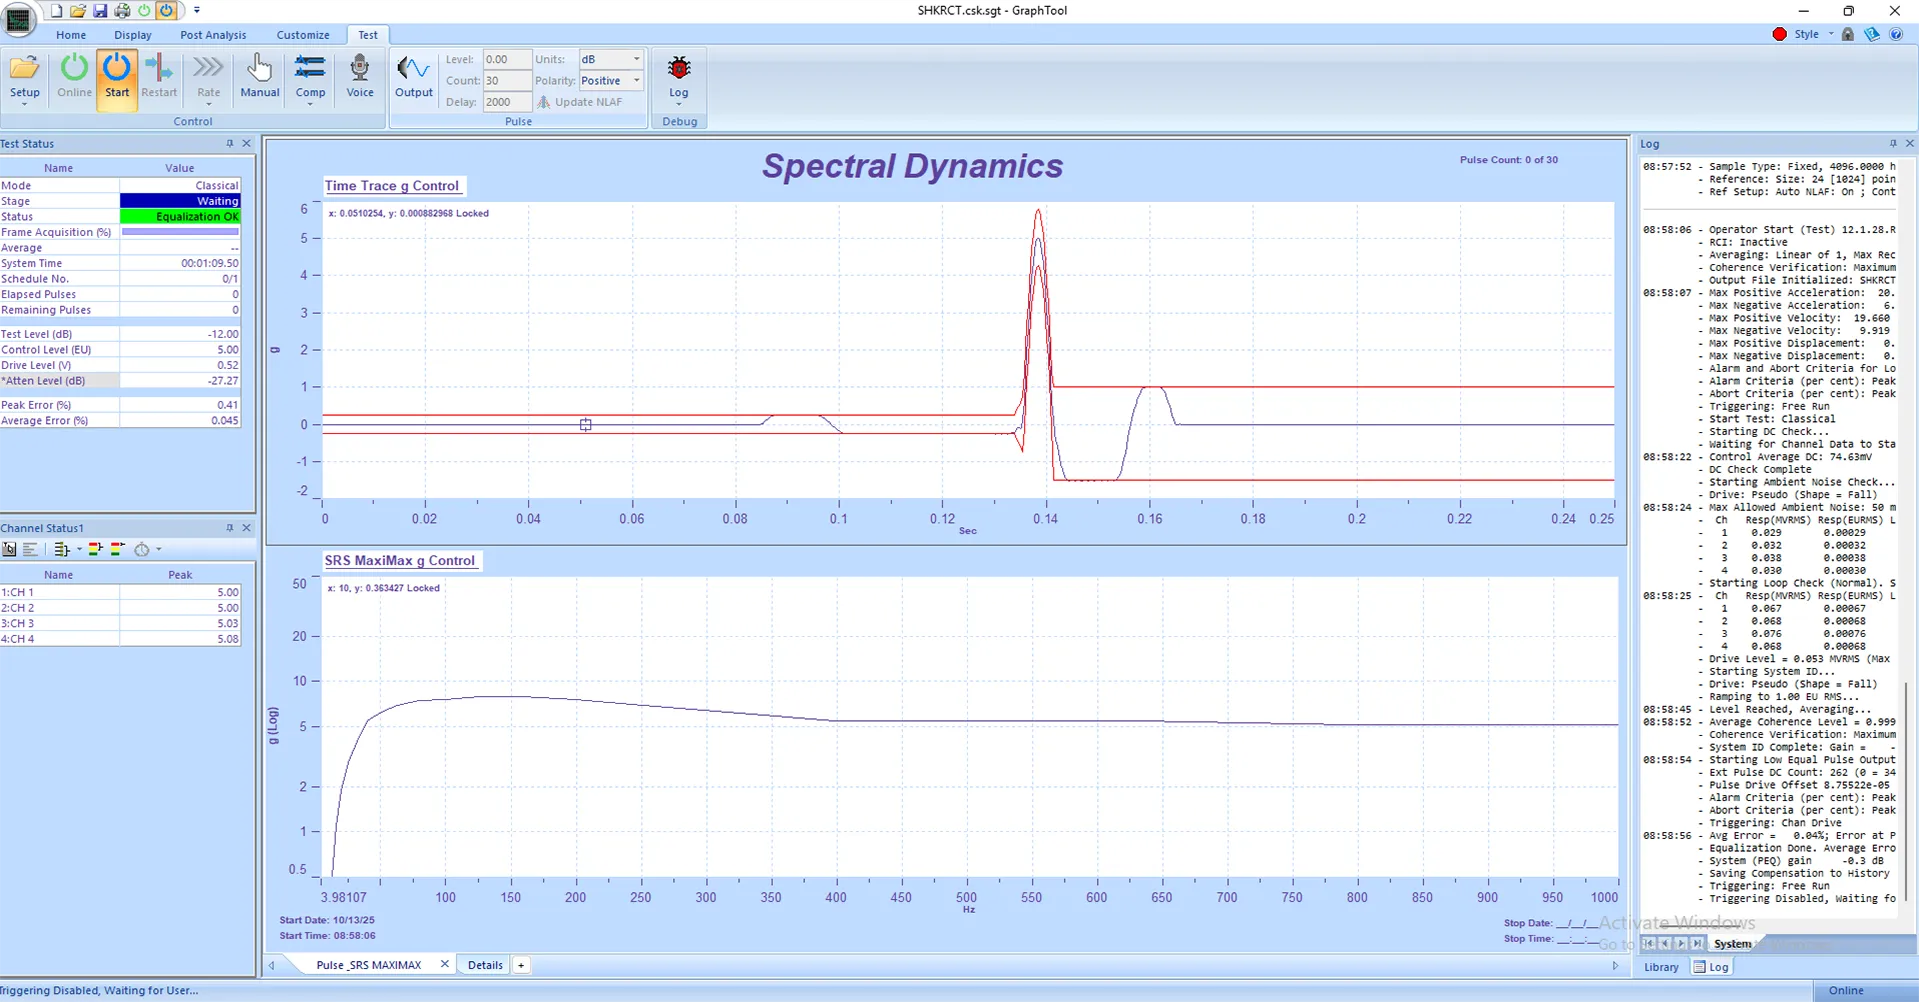
In shock testing, PANTHER Calculator scales shock response spectra (SRS) for comparison to specifications, calculates temporal differences between channels for time-of-arrival analysis in multi-point monitoring, determines peak acceleration values for maximum severity assessment, computes velocity change from acceleration time histories using integration, and generates derived shock parameters including impulse, momentum change, and energy content. These shock testing calculations support classical shock testing with standard pulses, shock response spectrum synthesis for complex waveforms, and pyrotechnic shock characterization for aerospace applications.
In noise, vibration, and harshness (NVH) testing, PANTHER Calculator computes A-weighted sound pressure levels from acoustic measurements for human perception assessment, calculates coherence functions between input and output channels for system linearity validation, determines frequency response functions for structural characterization and transfer path analysis, extracts specific frequency components from broadband measurements for tonal analysis, and processes order tracking data for rotating machinery NVH. These NVH calculations support automotive interior noise analysis, industrial machinery noise assessment, and architectural acoustics evaluation.
In road simulation testing, PANTHER Calculator calculates drive signals by scaling recorded road data for laboratory replication, normalizes multi-axis time histories for fixture dynamics compensation, determines kurtosis values for damage potential assessment and accelerated testing, computes equivalent PSD representations from time-domain data for spectral comparison, and derives fatigue damage spectra for durability assessment. These road simulation calculations support automotive component durability testing, vehicle dynamics analysis, and correlation between proving ground testing and laboratory simulation.
In modal analysis, PANTHER Calculator scales mode shapes for visualization and animation purposes, calculates modal participation factors for dynamic response prediction, determines frequency response functions from measured accelerance data, computes coherence between reference and response locations for measurement quality assessment, and derives modal parameters including natural frequencies, damping ratios, and mode shapes from curve-fitting operations. These modal analysis calculations support experimental modal analysis (EMA) for structural characterization, operational deflection shape (ODS) analysis for operating condition assessment, and model validation for finite element analysis correlation.
1. Document Custom Calculations with Descriptive Function Names: Use clear, descriptive function names clearly identifying calculation purpose and units. Examples include 'PSD_Norm_Chan1', 'ControlError_dB', 'TimeScaled_x1000', 'TransferFunction_H1'. Descriptive naming improves organization, enables other engineers to understand saved calculations, and facilitates long-term maintenance of calculation libraries. Include units in function names to prevent confusion about result interpretation.
2. Verify Calculation Results Using Known Test Data: Before applying custom calculations to critical production testing, validate calculations using known test data with predictable results. Create simple test cases where correct results can be verified manually or using independent calculation tools. This verification process identifies syntax errors, unit conversion mistakes, and logic problems before calculations affect actual test results. Maintain test validation records documenting verification methodology and results.
3. Use Variable Channel Designation for Maximum Reusability: Define calculations using X notation for channel designation whenever applicable, maximizing calculation reusability across different channels and test configurations. Variable designation eliminates need for separate calculations for each channel, reducing setup time and ensuring consistent processing methodology. Reserve channel-specific notation for calculations requiring particular channel combinations or when processing historical data with fixed assignments.
4. Save Frequently Used Calculations to GTX Library: Save custom calculations used across multiple test programs to GTX calculator library for rapid access during routine testing and analysis workflows. Organize calculator library by application type (Random, Sine, Shock), test program (automotive, aerospace, electronics), or analysis purpose (normalization, control error, derived measurements). Library organization streamlines test setup and ensures consistent calculation application across engineering teams.
5. Define Appropriate Axis Labels and Engineering Units: Configure axis labels and engineering units in calculation Result section ensuring calculated data displays with correct units and scaling in GTX graphs. Proper axis labeling prevents unit confusion, enables accurate data interpretation, and produces professional documentation. Include scale factors in axis labels when necessary (e.g., 'Acceleration (milli-g)' for scaled time traces).
6. Combine Calculator with GTX Cursor Functions: Use GTX cursor functions (single cursor, dual cursor, band cursor) to extract specific values from calculated results, enabling quantitative assessment of derived measurements. Cursor readouts display calculated values at specific frequencies or time points, supporting detailed data analysis and specification compliance verification. Export cursor data to Excel for further processing or inclusion in test reports.
7. Leverage Real-Time Calculation During Active Testing: Monitor derived parameters during active testing using real-time calculation capabilities, enabling immediate assessment of test quality without requiring post-test processing delays. Real-time calculations support adaptive test control, immediate problem identification, and dynamic quality assurance essential for long-duration durability testing and complex qualification programs.
8. Archive Calculation Definitions with Test Documentation: Include calculation definitions with test documentation, technical reports, and qualification packages ensuring reproducibility of analysis methods across multiple test programs and engineering teams. Document calculation syntax, purpose, applicable test modes, and any special considerations. Archived calculations enable verification of historical test results and maintain analysis methodology consistency over extended programs.
PANTHER Calculator seamlessly integrates with all GTX display and analysis capabilities, providing unified environment for vibration test data visualization, processing, and reporting. Calculated results display in standard GTX graph formats including XY plots for frequency response functions, waterfall displays for time-varying spectral content, color intensity maps for order tracking visualization, time traces for transient analysis, and 3D composite plots for rotating machinery analysis. Engineers apply all GTX cursor, zoom, and annotation tools to calculated data exactly as with directly measured channels, enabling comprehensive analysis workflows combining raw measurements, calculated derived parameters, and graphical presentation.
GTX integration enables real-time display of calculated results during active testing, side-by-side comparison of measured and calculated data in multi-graph layouts, overlay of calculated results with reference specifications for pass/fail assessment, and cursor-based extraction of specific values from calculated curves. The display integration maintains complete synchronization between calculated and measured data ensuring accurate phase relationships, timing correspondence, and frequency alignment essential for transfer function analysis, modal testing, and dynamic characterization applications.
Calculated data exports to all standard GTX output formats including Microsoft Word for technical reports, Microsoft Excel for spreadsheet analysis, PDF for documentation distribution, and image files (PNG, JPG, BMP) for presentations and publications. The export functionality includes calculated results with proper axis labeling, engineering units, and graphical formatting, ensuring derived measurements integrate seamlessly into engineering deliverables, quality records, and technical documentation. Automated report generation combines calculated results with test parameters, measurement data, and analysis summaries in professionally formatted documents meeting industry standards and customer requirements.
The PANTHER Calculator represents an essential component of the comprehensive GTX vibration testing environment, providing engineers with powerful data manipulation and analysis capabilities integrated seamlessly into testing workflows. From simple unit conversions and signal scaling to sophisticated multi-channel mathematical operations, the Calculator eliminates need for external data processing tools while maintaining flexibility required for specialized analysis applications. The combination of optimized default calculations for each testing mode, comprehensive custom calculation capabilities, real-time processing during active testing, and complete integration with GTX display and reporting functions makes PANTHER Calculator invaluable for efficient vibration testing operations.
Vibration test engineers gain ability to derive specialized measurements, validate test quality, compare results across multiple tests, and generate custom analysis parameters—all within the unified PANTHER testing environment. The Calculator's support for frequency-domain operations (PSD normalization, control error calculation, spectral analysis), time-domain operations (time trace scaling, differential measurements, temporal analysis), and custom mathematical functions (logarithms, trigonometry, statistics) provides comprehensive data processing capability addressing diverse vibration testing requirements across automotive, aerospace, electronics, and structural dynamics applications.
Understanding PANTHER Calculator capabilities, including default calculations, custom calculation creation, channel notation system, mathematical operations, and practical applications across testing modes, enables vibration test engineers to maximize testing efficiency, improve data quality, and extract maximum value from vibration test programs. The Calculator transforms raw measurement data into actionable engineering information supporting design validation, quality assurance, failure investigation, and continuous improvement across modern vibration testing laboratories worldwide.
PANTHER Calculator is an integrated data manipulation tool within GTX software that enables vibration test engineers to perform real-time and post-test data processing operations. It provides capabilities for normalizing PSD data, calculating control errors in decibels, performing time-domain calculations including subtraction and multiplication, creating custom mathematical operations using logarithms and trigonometric functions, executing multi-channel operations across all measurement channels, and processing live data during active vibration testing. The Calculator operates on stored data files (.SDD format), live acquisition data, and time stream recordings (.STX format), providing comprehensive data processing capability across random vibration testing, sine vibration testing, shock testing, and modal analysis applications.
PSD normalization in PANTHER Calculator divides Power Spectral Density data by the maximum PSD value using the formula: <PSD,g²/Hz[X,Off]> / max(<PSD,g²/Hz[X,Off]>). To normalize PSD data: 1) Open stored random vibration test data file (.SDD) using Display > Plot > Source, 2) Access Calculator from Home > Tools > Calculator, 3) Select 'PSD Normalize' from Input Calculation dropdown, 4) Give calculation custom name and click 'Add to List', 5) Click OK to return to GTX, 6) Select new calculation from Display > Plot > Function dropdown, 7) Choose desired channel to view normalized PSD. The normalized result displays with peak value of 1.0 enabling direct comparison of spectral shapes across different test amplitudes.
PANTHER Calculator performs: PSD normalization dividing by maximum values for random vibration comparison, control error calculations in decibels comparing measured to reference signals, time-domain calculations including subtraction, addition, multiplication and division, weighted averages combining multiple channels with user-defined factors, custom mathematical operations using logarithms (log10, ln), trigonometric functions (sin, cos, tan), square root operations for RMS calculations, statistical functions (max, min, average) for peak detection, and conditional operations for threshold detection and pass/fail evaluation. The Calculator supports both frequency-domain data (PSD, magnitude spectra, frequency response functions) and time-domain data (time traces, transient captures, shock pulses) with real-time processing during active testing and post-test analysis of stored data files.
Create custom vibration test calculations using seven-step process: 1) Access Calculator from Home > Tools > Calculator, 2) Click 'New' button to create custom calculation, 3) Select 'Function' from dropdown and click 'Add', 4) Choose 'X' for universal channel designation, set Reference Channel to 'Off', select Function type (Time Trace, PSD, etc.) and Operator Name (engineering units), 5) Add mathematical operators and values to function notation (example: <Time Trace,g[X,Off]> * 1000 for scaling), 6) Configure Result parameters including Function Name (menu identifier), Operator Name (result units), X Axis Label and Y Axis Label, 7) Click 'Update in List' then 'OK' to save. New calculation appears immediately in Plot > Function dropdown for application to any measurement channel with automatic unit handling and result display.
Channel notation [X,Off] specifies which measurement channels calculations apply to using bracket format [Channel Number, Reference Channel Number]. 'X' represents variable channel number allowing same calculation to be applied to any selected channel (channel 1, channel 2, or any active channel) without requiring separate calculation definitions. 'Off' indicates no reference channel is used in the calculation, appropriate for single-channel operations like normalization or scaling. Alternative notations include [1,2] for comparing channel 1 to channel 2 reference, [X,Reference] for comparing any channel to designated reference profile, and [1,Off] for calculations specific to channel 1 only. This flexible notation enables universal calculations maximizing reusability across different measurement channels and test configurations in multi-channel vibration testing.
Yes, PANTHER Calculator executes calculations on live data during active vibration testing providing immediate derived measurements and calculated parameters. Real-time processing enables dynamic test monitoring including control error assessment during random vibration testing, transfer function calculation during sine sweep testing, peak detection during shock testing, and weighted average monitoring during multi-axis control. Engineers monitor calculated results in GTX displays with update rates of 10-25 times per second matching underlying data acquisition system. Real-time calculation capability enables immediate assessment of test quality, proactive problem identification, adaptive test control based on derived parameters, and continuous validation during long-duration durability testing without requiring post-test processing delays.
Random vibration testing includes four factory-defined default calculations: PSD Normalize using formula <PSD,g²/Hz[X,Off]> / max(<PSD,g²/Hz[X,Off]>) dividing by maximum PSD value for spectral shape comparison, PSD Weighted Average using (((<PSD,g²/Hz[1,Off]>*3) + (<PSD,g²/Hz[2,Off]>*1)) / 4) calculating weighted combination from multiple channels for multi-axis control, Control Error using (10 * $log10(<PSD,g²/Hz[X,Off]> / <PSD,g²/Hz[Reference,Off]>)) computing difference in decibels between measured and reference PSD, and Time Channel Difference using <Time Trace,g[X,Off]> - <Time Trace,g[RX,Off]> calculating time-domain difference between control and response channels. These pre-configured calculations are immediately available for use with stored or live random vibration test data.
PANTHER Calculator seamlessly integrates with all GTX display and analysis capabilities. Calculated results display in standard GTX graph formats including XY plots, waterfall displays, color intensity maps, time traces, and 3D composite plots. Engineers apply all GTX cursor functions (single, dual, band cursors), zoom controls, and annotation tools to calculated data exactly as with directly measured channels. Calculated data exports to Microsoft Word, Excel, PDF, and image files (PNG, JPG, BMP) with proper axis labeling, engineering units, and graphical formatting. Integration enables side-by-side comparison of measured and calculated data in multi-graph layouts, overlay with reference specifications for pass/fail assessment, automated report generation combining calculated results with test parameters, and comprehensive analysis workflows unifying raw measurements, derived parameters, and professional documentation.
PANTHER Calculator supports comprehensive mathematical operations including: basic arithmetic (addition +, subtraction -, multiplication *, division /) for scaling, offsetting, and combining channels, logarithmic functions (log10, natural log) for decibel calculations and logarithmic transformations, trigonometric functions (sin, cos, tan, asin, acos, atan) for phase calculations and harmonic analysis, root operations (sqrt) for RMS calculations and standard deviation computations, statistical functions (max, min, average) for peak identification and summary parameters, and conditional operations (comparison operators >, <, ==, Boolean logic AND, OR, NOT) for threshold detection and pass/fail evaluation. These operations apply to frequency-domain data (PSD, magnitude spectra, frequency response functions) and time-domain data (time traces, transient captures) with automatic unit handling and dimensional consistency validation.
Practical applications include: Random vibration testing (normalize PSD profiles for comparison, calculate control errors for quality assessment, compute Grms values for specification compliance, determine kurtosis for damage potential), Sine vibration testing (calculate transfer functions dividing response by control, determine phase relationships for resonance characterization, compute transmissibility ratios for fixture validation), Shock testing (scale shock response spectra for specification comparison, calculate temporal differences for time-of-arrival analysis, determine peak values for severity assessment), NVH testing (compute A-weighted sound levels for human perception, calculate coherence functions for system linearity, extract tonal components from broadband measurements), Road simulation (calculate drive signals scaling recorded data, normalize multi-axis time histories, compute equivalent PSD from time-domain), and Modal analysis (scale mode shapes for visualization, calculate participation factors, determine frequency response functions from measured data).
Panther Applications
Panther Field Data Replication Control delivers precision and performance in time-domain waveform...

Panther Analyzer extends the power of Spectral Dynamics' next-generation Panther platform with...
Spectral Dynamics invented closed-loop digital vibration control and continues to lead with...
Spectral Dynamics invented closed-loop digital vibration control and continues to innovate with...
Panther Random on Random Control delivers precision and performance in multi-environment vibration...
Panther Shock Control delivers precision and performance in transient vibration testing. Built on...
Panther Sine Control delivers unmatched precision and stability for both swept-sine and...
Panther Sine-on-Random Control delivers precision and performance in mixed-mode vibration testing....
![]()
![]()
![]()