Panther – Field Data Vibration Test Replication Software
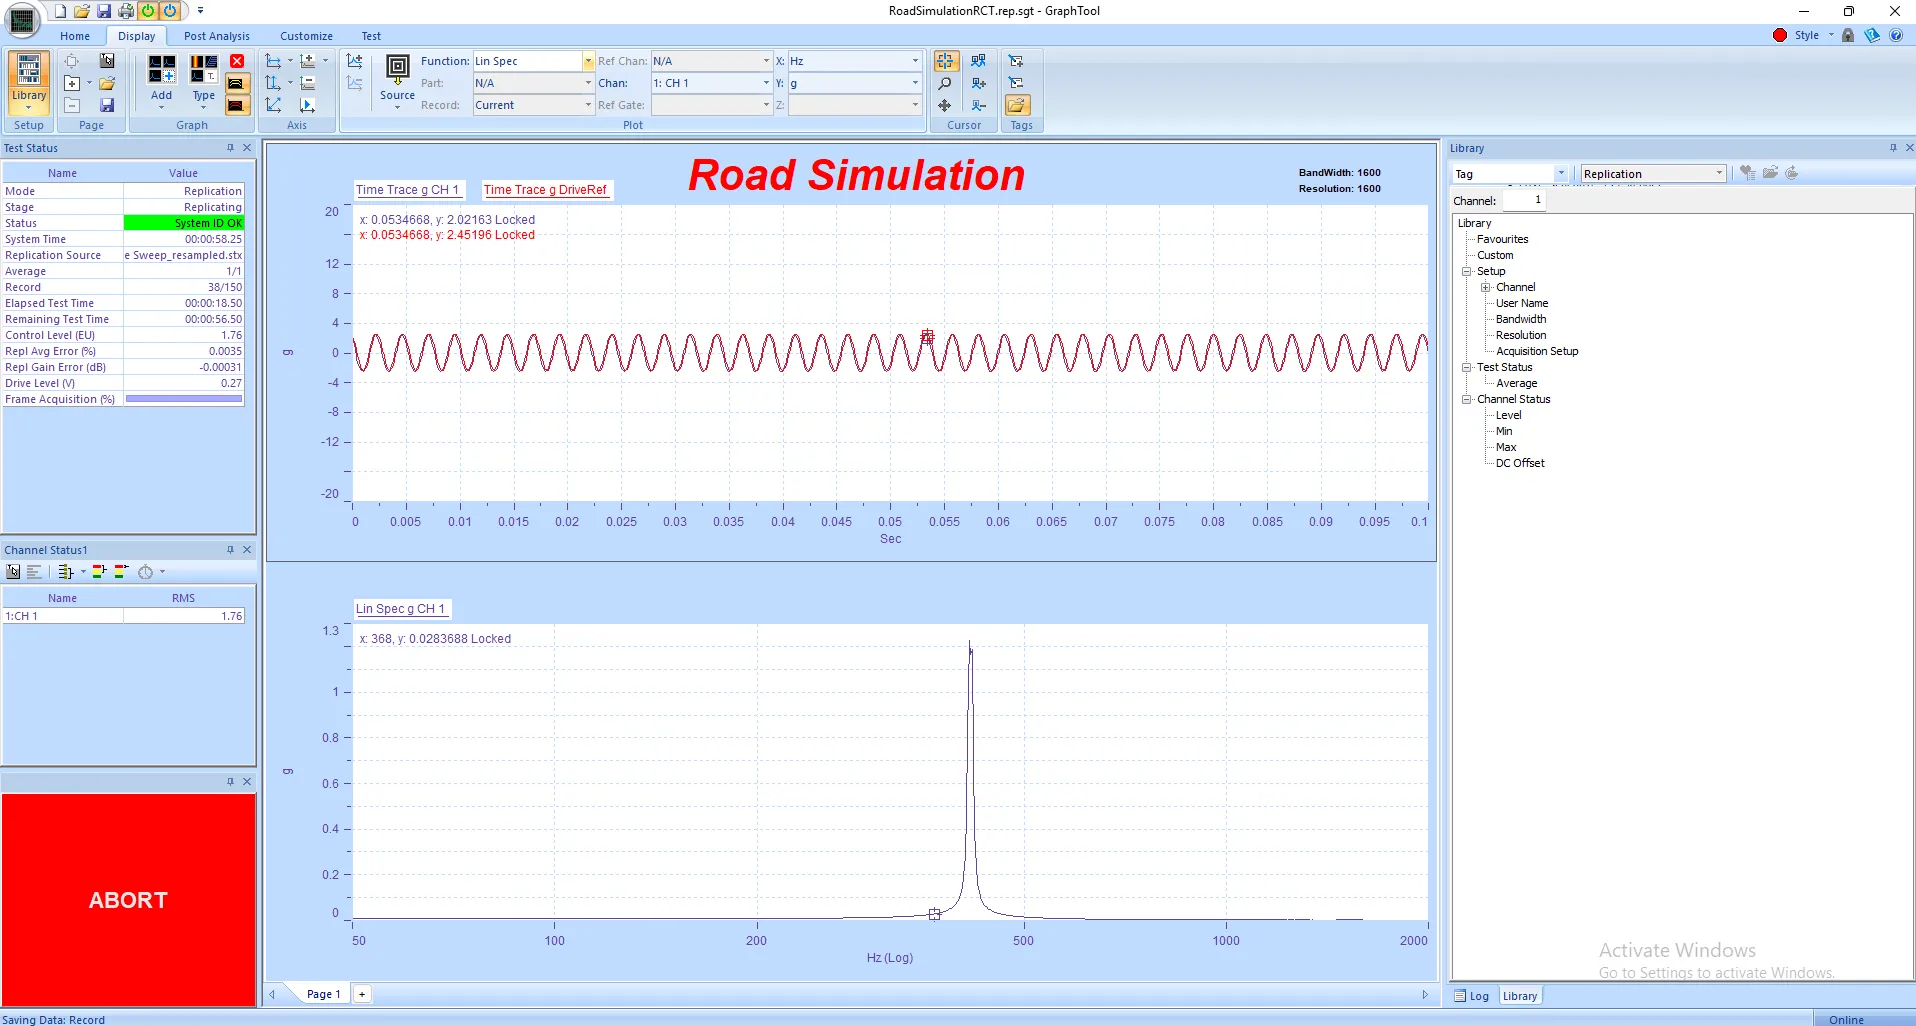
Panther Field Data Replication Control delivers precision and performance in time-domain waveform...
 Report Generation allows the user to output a report in a single Microsoft Word document, Adobe PDF or a collection of images in a folder at the end of a test.
After selecting either Word, PDF or Image (PNG, BMP, JPG) output type, the user can then define what data to be exported (all frames or last frame of test), pre and post-test forms, test synopsis (detailing all attributes and status of the test), notes, picture or boilerplate.
 Test Synopsis
Configuring a synopsis report allows the user to select which section of the test's setup is to be included in the end of test report as well as the result of the test.
| Pre and Post-test Forms |
Forms can be deployed at both the start and end of a test, requiring the operator to make necessary safety checks, or possibly to describe how the test completed. Example forms provided with the software can be used or you can customize a form using your own HTML code as shown below.

Alternatively you can have the software import simple HTML controls with just a few mouse clicks. Modifying the HTML source can be done with built in HTML text editor.

| Customize the Report's Output in Microsoft Word or Adobe PDF. Having the report output to Word makes it simple for anyone to make additions or edits to the final report. |


| Reporting During a Live Test |

Additionally, the user at any time can generate a report during a live or post analysis test using a one button-click. This output supports the following formats:
Example of a Single Click Excel Report
At any time while a plot is visible, either during live data or post analysis, the user with a single mouse click can output the X/Y values of the active plot and export it to Excel document. An additional X/Y graph will automatically be generated as well.


Panther Applications
Panther Field Data Replication Control delivers precision and performance in time-domain waveform...

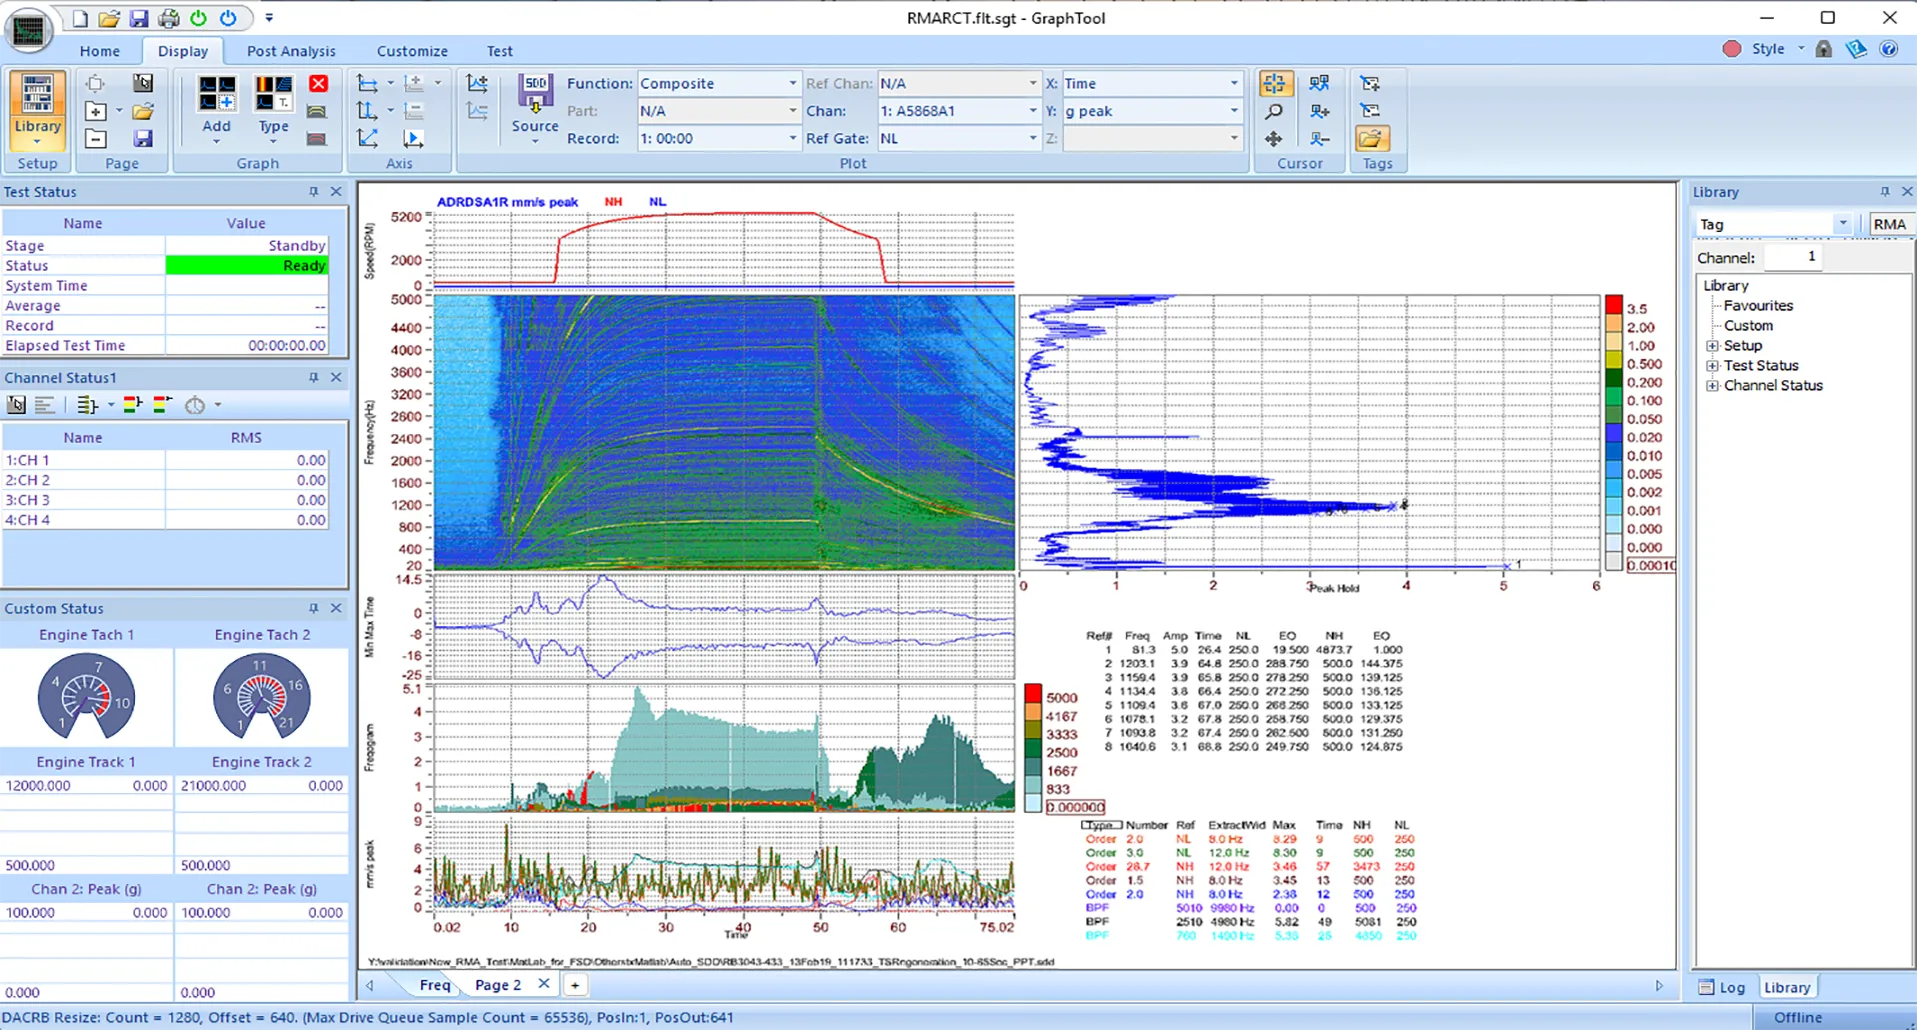
Panther Analyzer extends the power of Spectral Dynamics' next-generation Panther platform with...
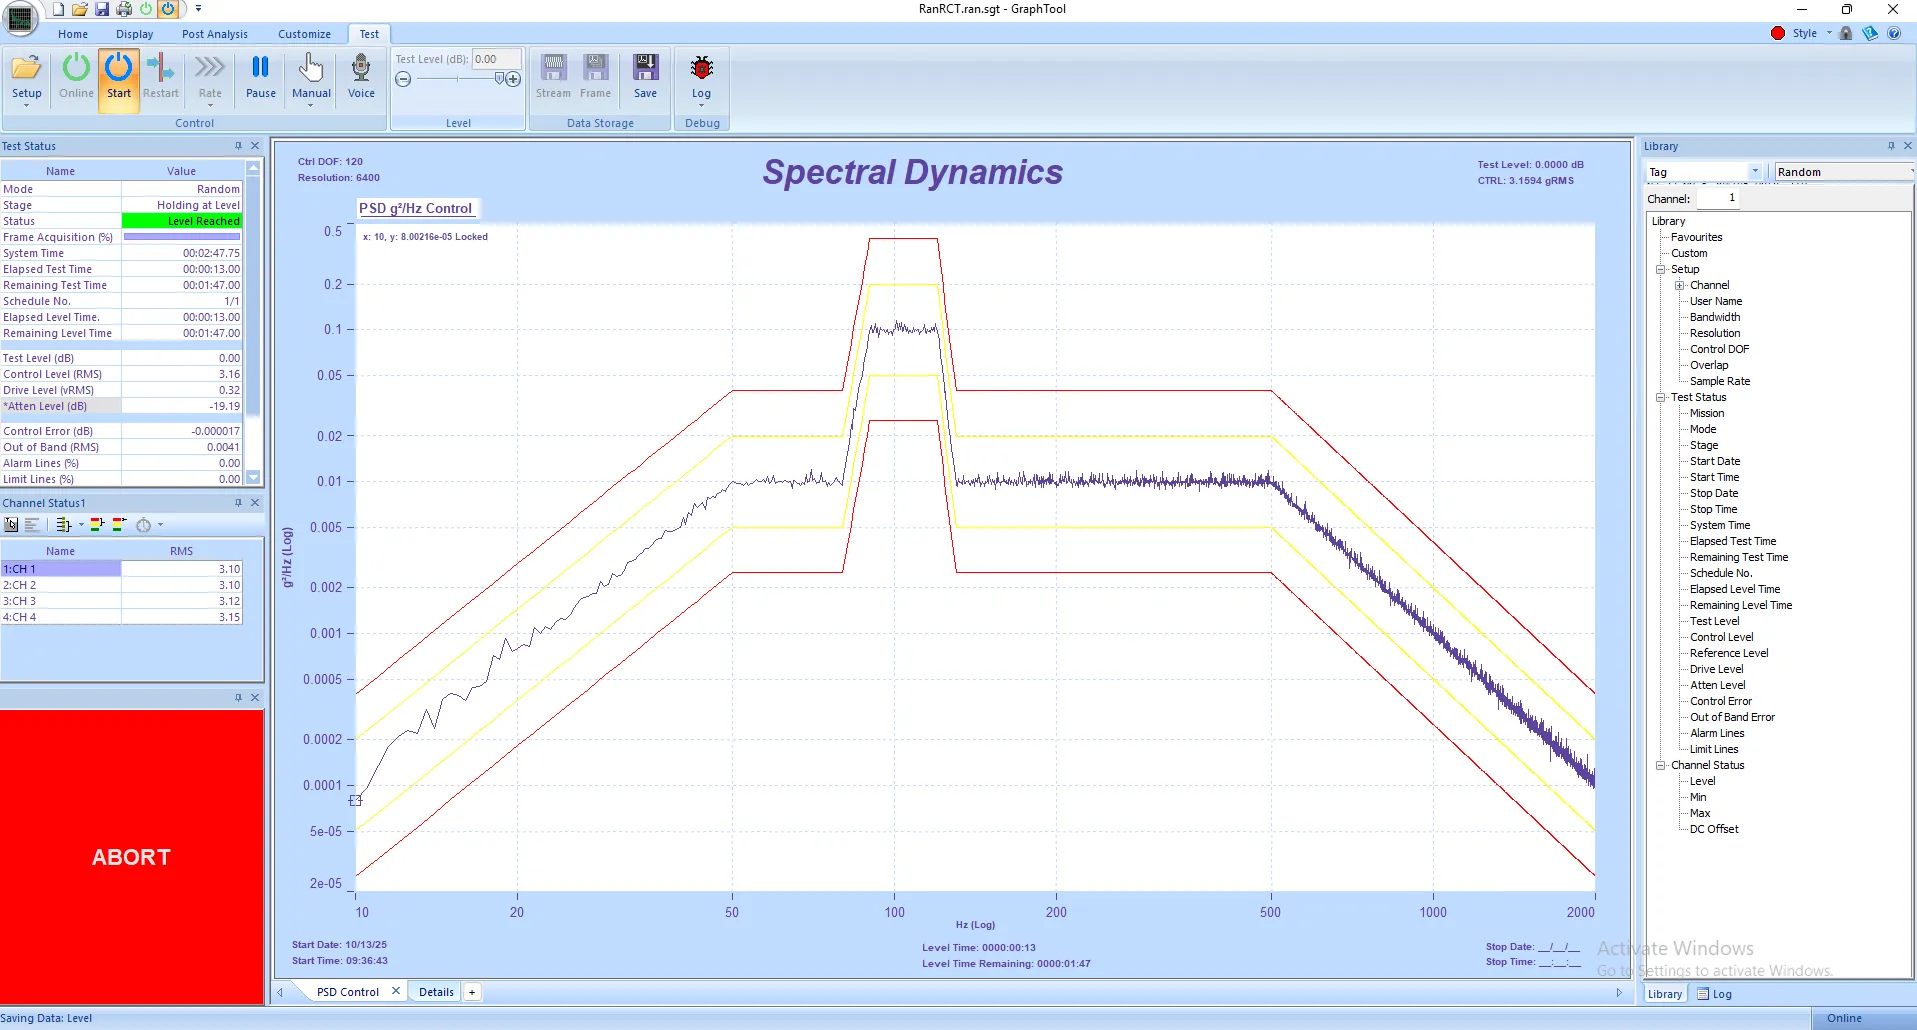
Spectral Dynamics invented closed-loop digital vibration control and continues to lead with...
Spectral Dynamics invented closed-loop digital vibration control and continues to innovate with...
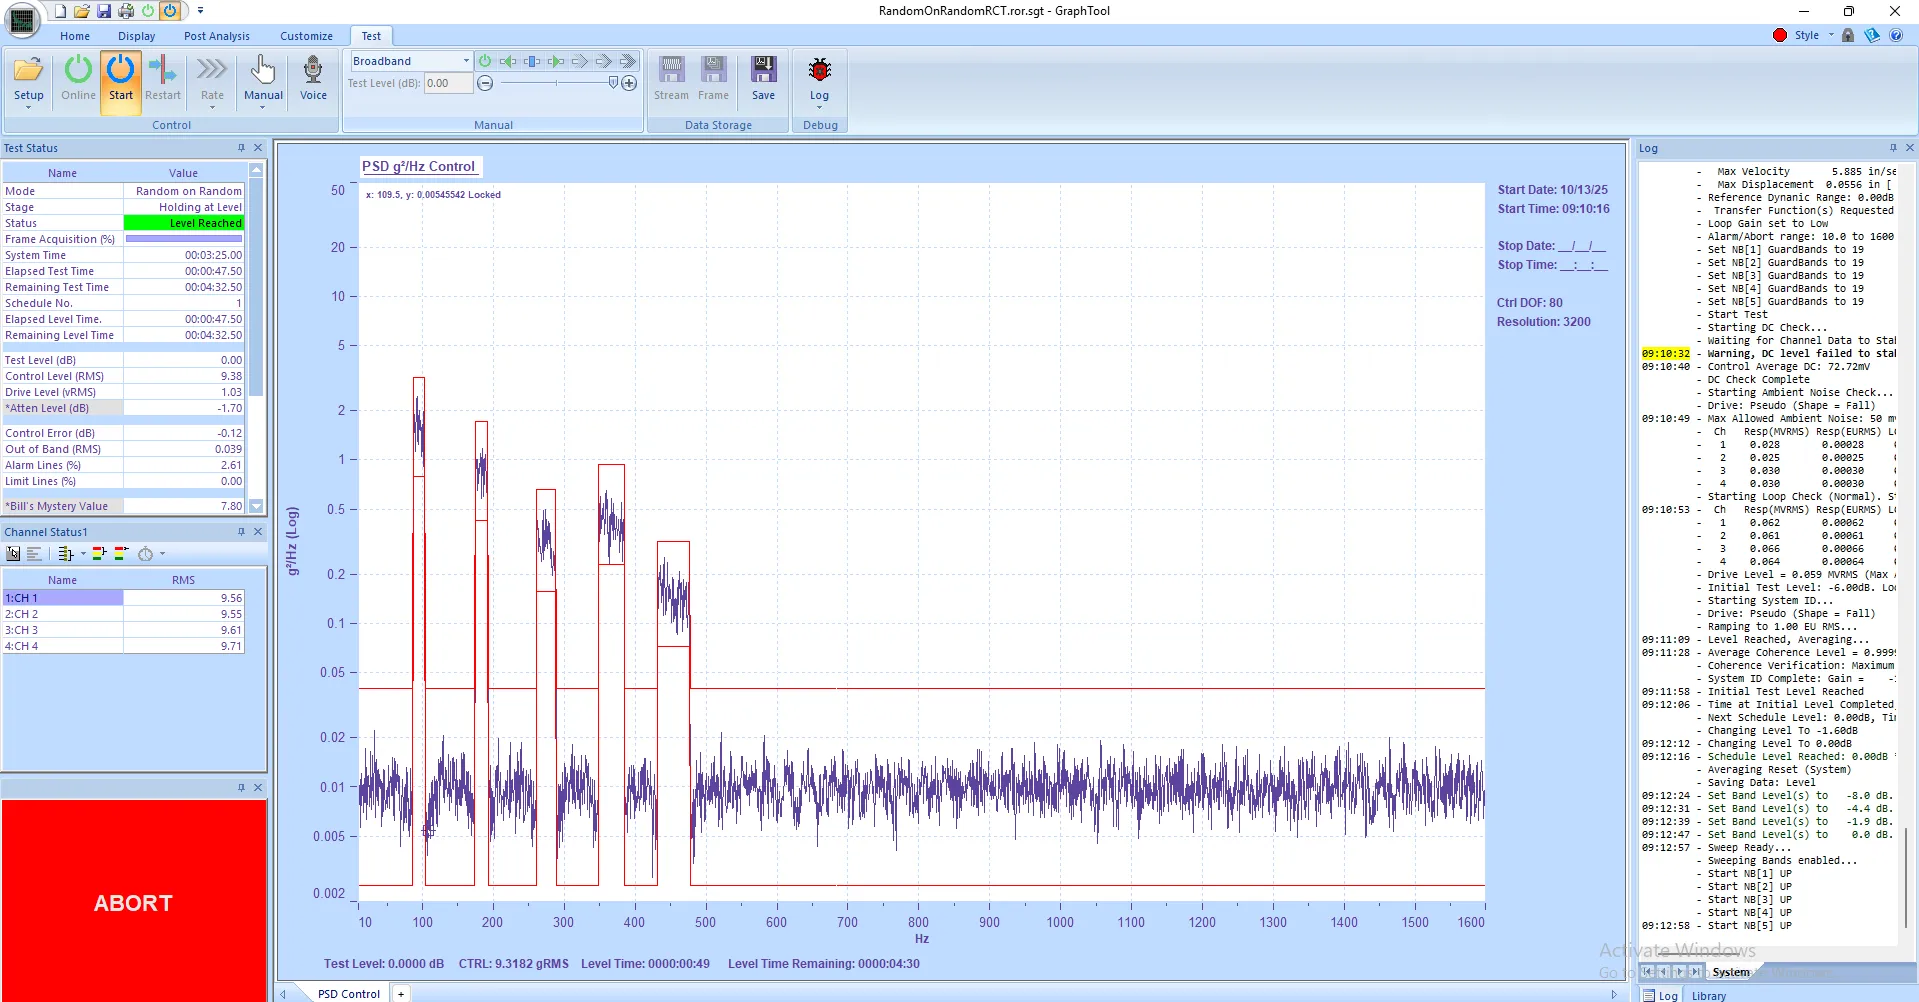
Panther Random on Random Control delivers precision and performance in multi-environment vibration...
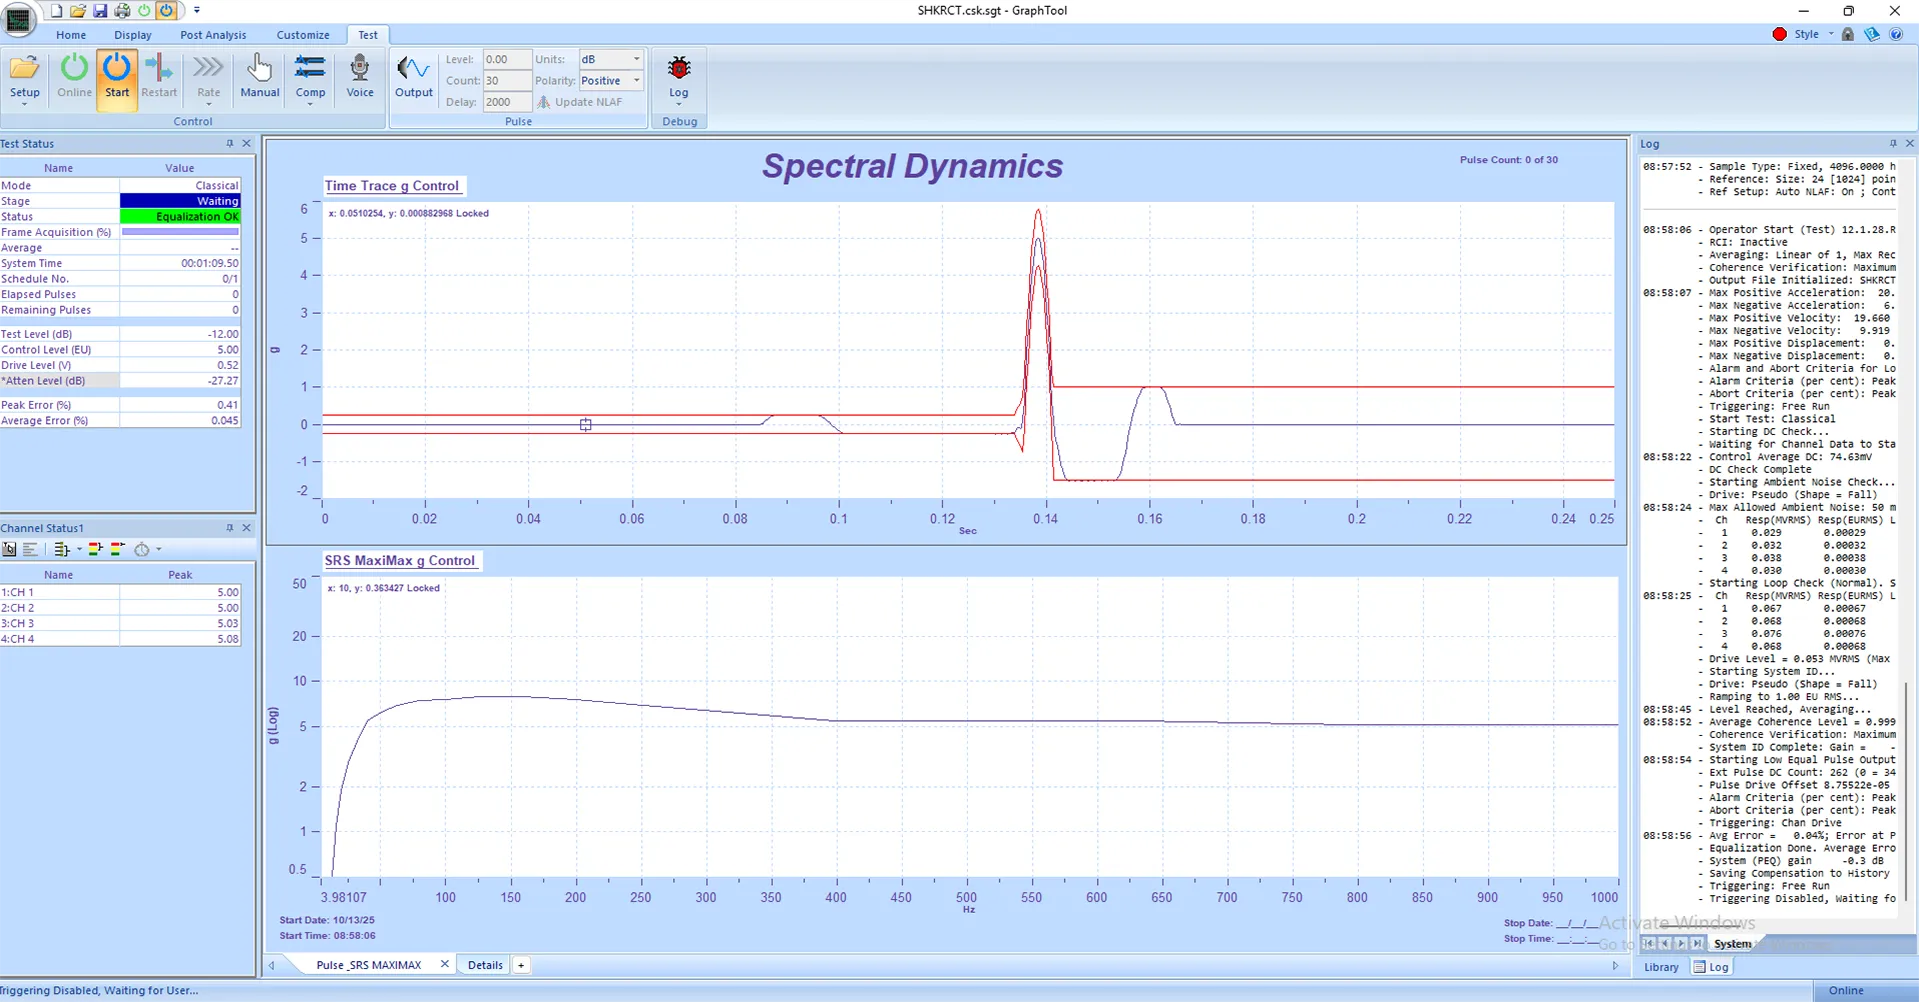
Panther Shock Control delivers precision and performance in transient vibration testing. Built on...
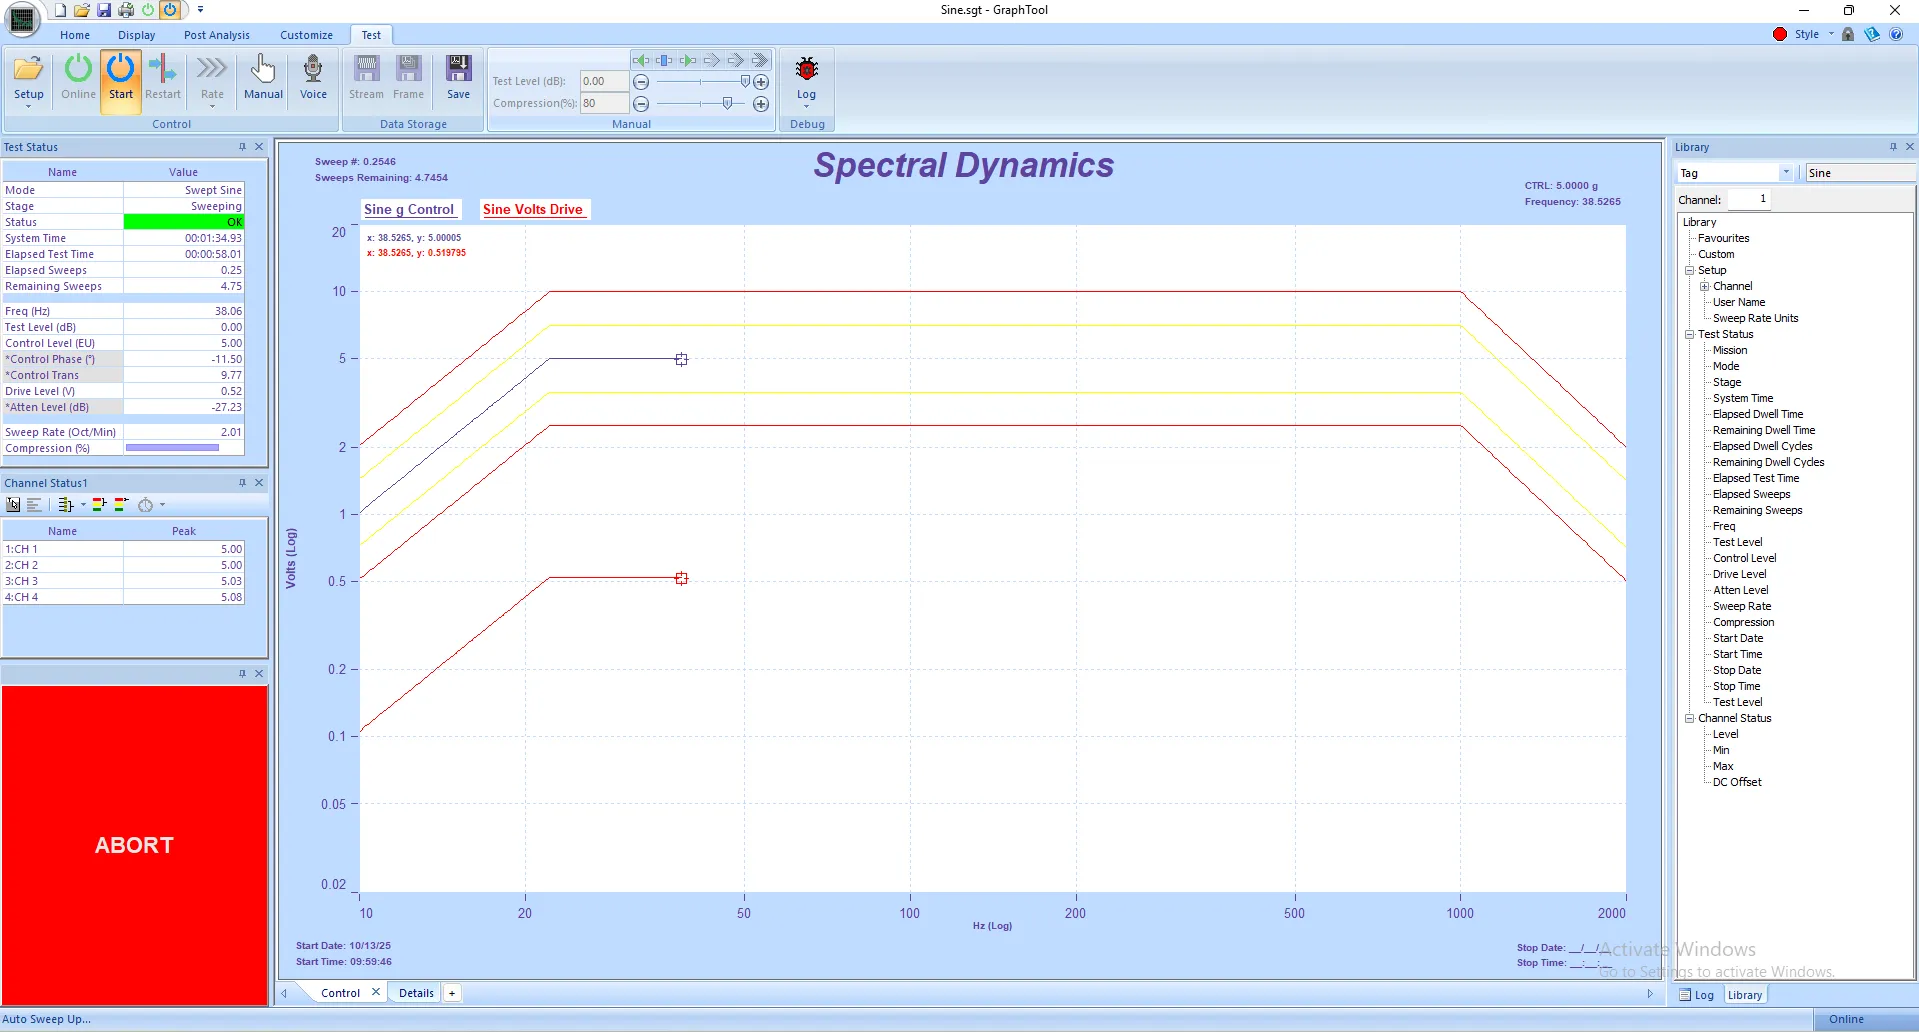
Panther Sine Control delivers unmatched precision and stability for both swept-sine and...
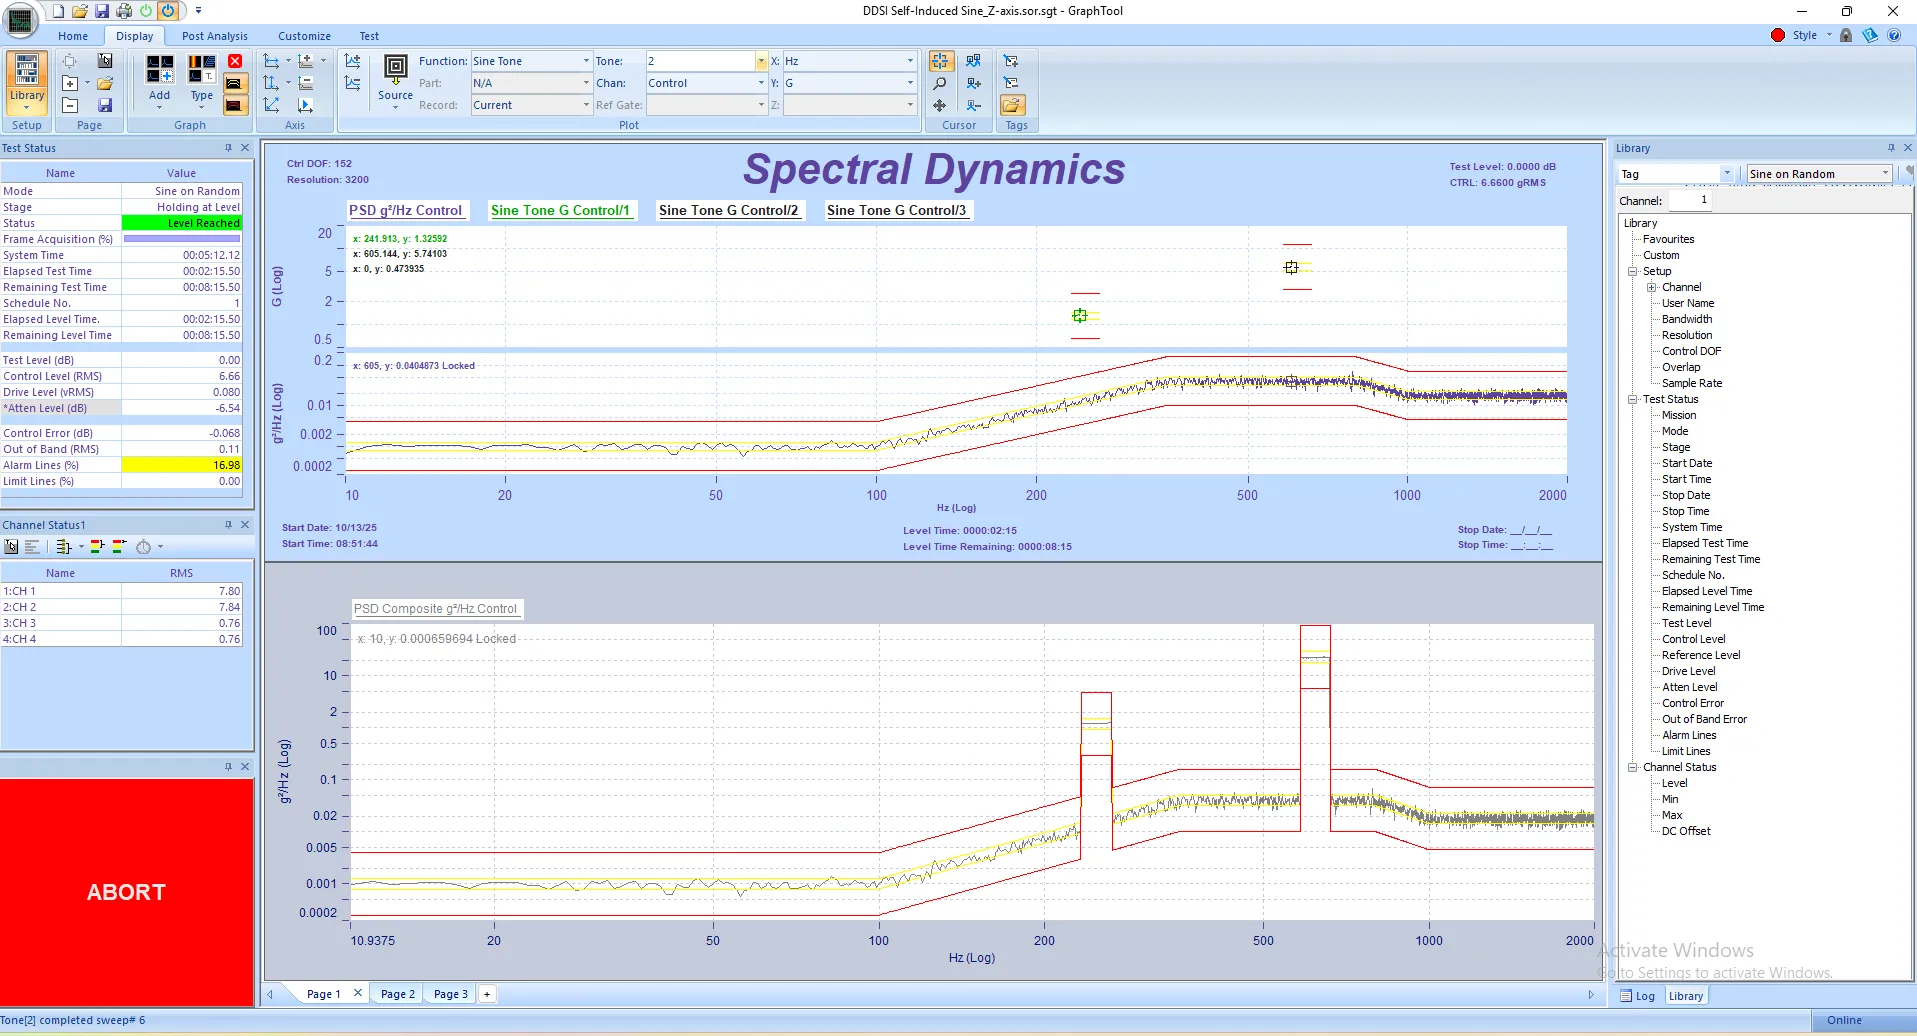
Panther Sine-on-Random Control delivers precision and performance in mixed-mode vibration testing....
![]()
![]()
![]()