Panther – Field Data Vibration Test Replication Software
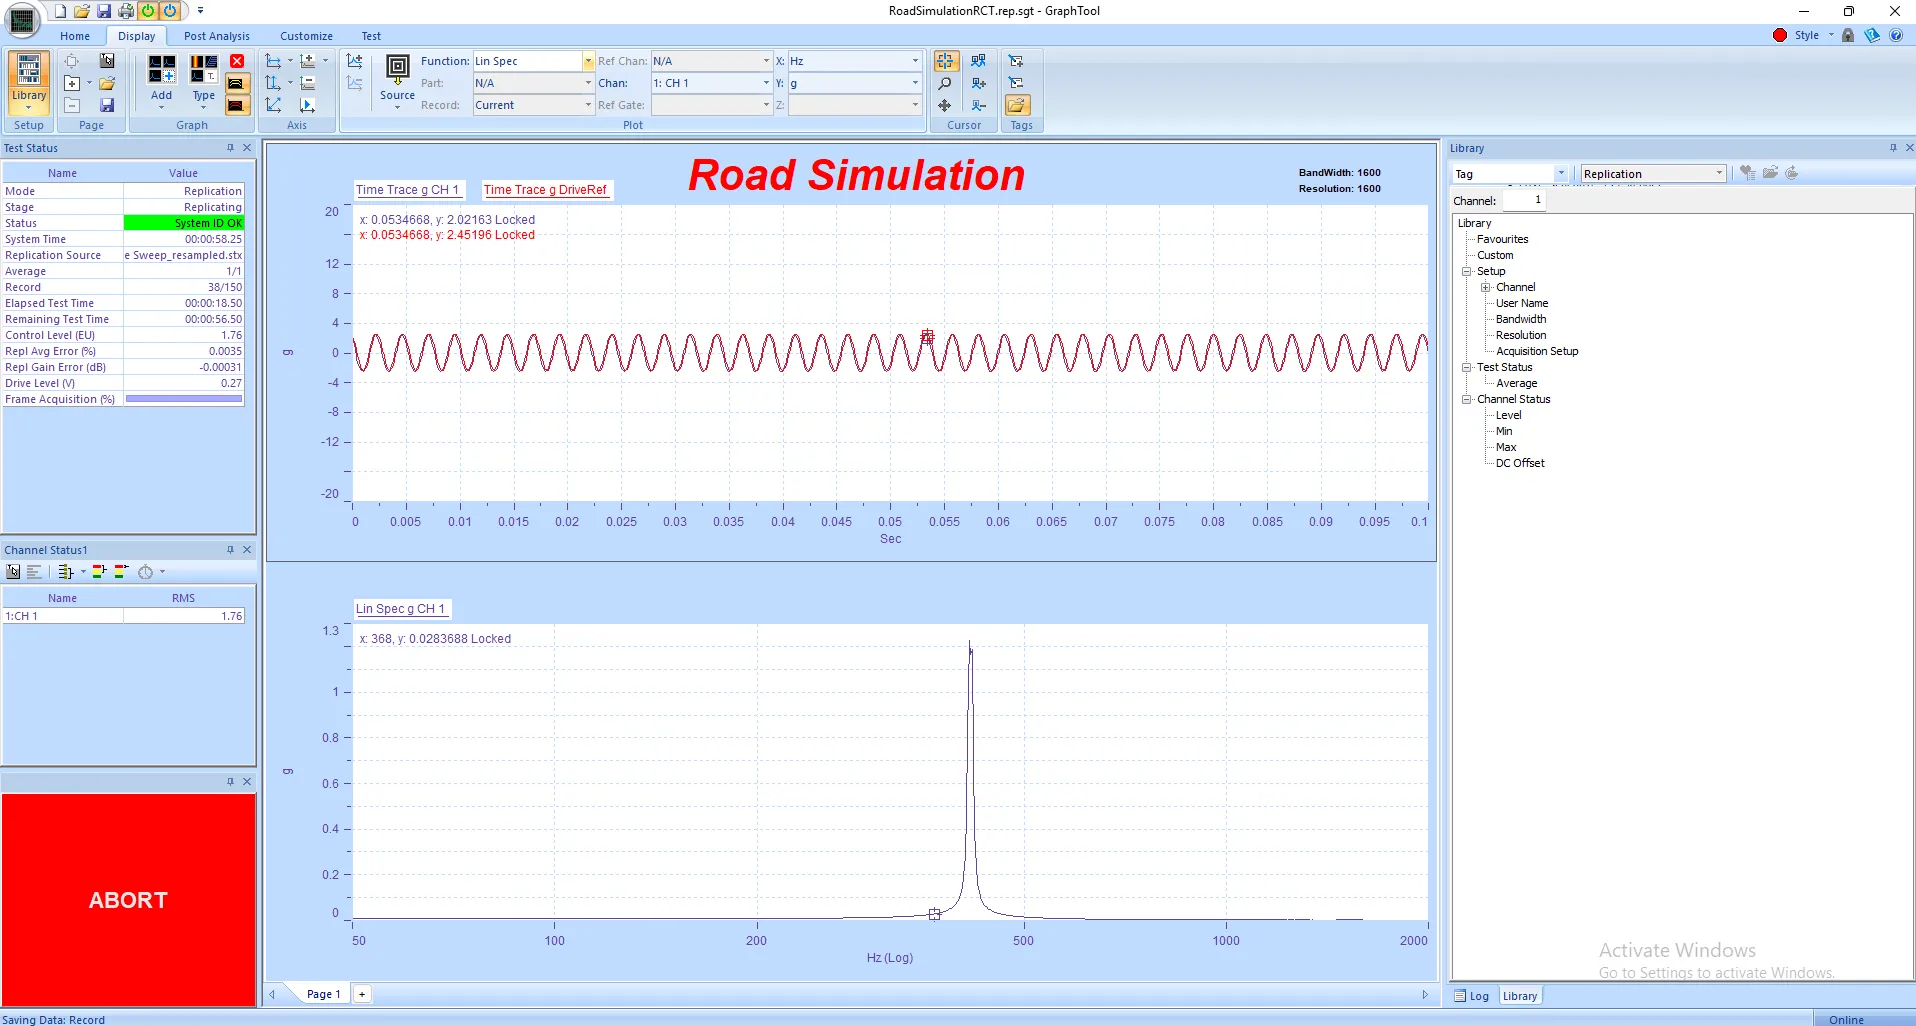
Panther Field Data Replication Control delivers precision and performance in time-domain waveform...

ShakerCheck is the five-minute pre-test check for your shaker, fixture and instrumentation. It drives one low-level sine tone or sweep, measures every channel at once, and tells you which channel, fixture or shaker needs attention. You leave with a saved baseline and a printable PASS / CHECK report.
| Ch | Accel G | Disp in pp | vs Ctrl |
|---|---|---|---|
| 1 Table ctrl | 0.1000 | 0.00122 | Control |
| 2 Fixture NE | 0.0991 | 0.00121 | −0.9 % |
| 3 Fixture SW | 0.0502 | 0.00061 | −49.8 % |
| 4 Lateral Y | 0.0063 | 0.00008 | 6.3 % x-axis |
CHECK A CHANNEL · Fixture SW reads −49.8 %. Its mV/g is likely out by 2x.
A bad rig rarely announces itself. It produces data that looks reasonable and is wrong, and you find out after the test time, the specimen life and the result are spent.
Enter 100 mV/g where it should be 200 and the channel reports a plausible number that is off by exactly 2x. Nothing in the reading gives it away.
The control loop holds the response at the demand whatever the shaker does. The response trace stays flat while the hardware drifts.
A fixture can lose its usable range to a mode the control accelerometer never sees.
Without knowing which axis each sensor measures, a rocking fixture passes as normal and a healthy cross-axis sensor looks like a failure.
One controlled sine signal: a steady tone held as long as you need, or a sweep across your band at the rate you set. Hold, walk or re-level a running sweep without stopping it. Output never exceeds 1.0 G pk.
| Reading | Units | Tells you |
|---|---|---|
| Acceleration | G pk | The response at each point |
| Velocity | in/s pk | Derived from acceleration and frequency |
| Displacement | in pk-pk | How close the shaker is to its stroke limit |
| Phase | deg | A resonance, as distinct from a change in gain |
| Transmissibility | ÷ Control | How much of the input reaches each point |
| Drive | V | What the controller puts out to hold level |
| Cross-axis | % of Control | Whether the fixture translates or rocks |
A healthy loop holds the response at the demand, so a softening shaker barely shows there. What changes is how hard the loop had to work. Drive follows 1/|H|: its troughs sit on resonances and its peaks on anti-resonances. ShakerCheck reads shaker health from that fingerprint.
shift in a first mode, in Spectral Dynamics verification on a known plant
change seen on every response channel. A response-only check passes it.
change in the drive. ShakerCheck flags it: CHECK THE SHAKER.
The same work showed why more than one accelerometer matters: on a test fixture model the usable range ended at 237 Hz because of a 300 Hz corner mode the control point never felt. ShakerCheck uses every channel you mount, up to eight on a Panther.
About 15 minutes the first time and 5 once it's familiar. The procedure lives in the app's help, step by step.
Connect, then fill in the channel table: name, sensitivity, coupling, role and axis. Exactly one Control channel, confirmed on the main window.
steps 1–8A low tone, typically 20–60 Hz at 0.1 G pk. One click checks every channel: in-axis within 10 %, cross-axis under 30 %.
steps 9–12Load a baseline, then sweep your band, e.g. 50–2000 Hz at 2 oct/min in about 3 minutes. Get resonances, cross-axis peaks and usable range.
steps 13–18Add a note, save the run as CSV, and generate the report. The CSV becomes next time's baseline.
steps 19–22| Device | Panther |
| Excitation | 50 to 2000 Hz at 2 oct/min |
| Level | 0.1 G pk |
| Compared against | 2026-06-02 08:51 |
| Check | Criterion | Measured | Result |
|---|---|---|---|
| Channel agreement | spread vs control – information for a sweep | NE −4.2 % | information |
| Cross-axis | below 30 % of control | Lat Y 11.8 % at 640 Hz | PASS |
| Baseline | nothing moved more than 3 dB | Drive +7.6 dB at 184 Hz | CHECK |
| • drive | the shaker-health signal | +7.6 dB at 184 Hz | CHANGED |
| • response | the loop flattens this | NE +1.4 dB at 190 Hz | information |
Read this one for shaker health. A moved mode shows as a pair of opposite excursions bracketing it.
Sample report, illustrative values.
Every check ends in a self-contained HTML report. It opens in any browser, prints cleanly, and links to the run's CSV so the pair travels together. The banner names what to look at first.
It never shows a green banner over a failed row.
These are Spectral Dynamics' own engineering limits; no published standard sets them. The report always prints the measured values, so you can apply your own. The 3 dB line is about five times run-to-run repeatability on the same rig (0.60 dB worst case).
A guided, repeatable five-minute check with a clear answer.
Confidence in channels, fixture and shaker before committing a specimen.
A dated, printable record of rig condition for every test.
Baseline trending that catches a tiring shaker before it fails a test.
ShakerCheck is the check before the test. It doesn't write profiles or replace the controller. Sine analysis is narrowband, so it catches dead and mis-scaled channels but not broadband noise. It gives you resonances and usable range; the engineering decision stays with you. For a full characterization of what the rig can deliver, see ShakerScope.
About 15 minutes the first time and about 5 once it is familiar. The procedure lives in the app's help, step by step.
Spectral Dynamics Panther and Lynx. It uses every channel you mount, up to eight on a Panther.
It never commands more than 1.0 G pk, won't start while Panther or Lynx is open, and won't output until it confirms nothing else owns the hardware.
It doesn't write profiles or replace the controller. Its sine analysis is narrowband, so it catches dead and mis-scaled channels but not broadband noise.
ShakerCheck works with Spectral Dynamics Panther and Lynx controllers.
Panther Applications
Panther Field Data Replication Control delivers precision and performance in time-domain waveform...

Panther Analyzer extends the power of Spectral Dynamics' next-generation Panther platform with...
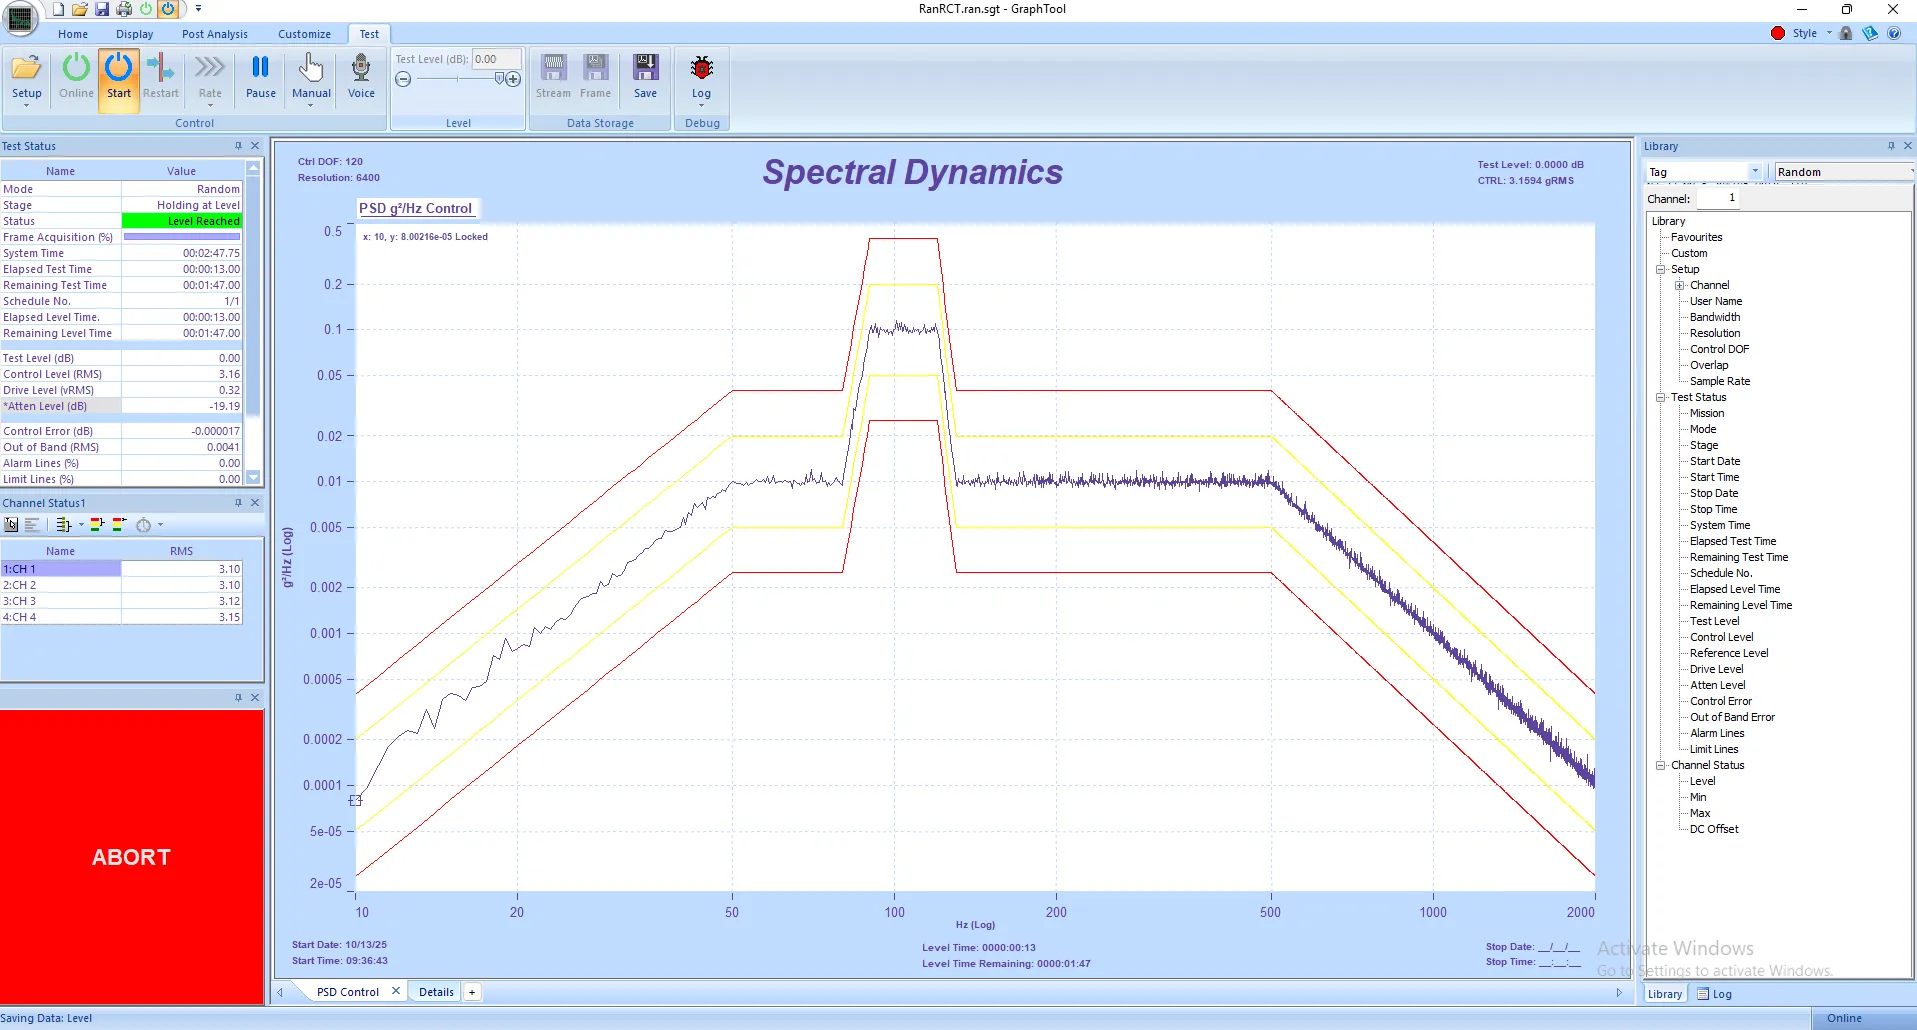
Spectral Dynamics invented closed-loop digital vibration control and continues to lead with...
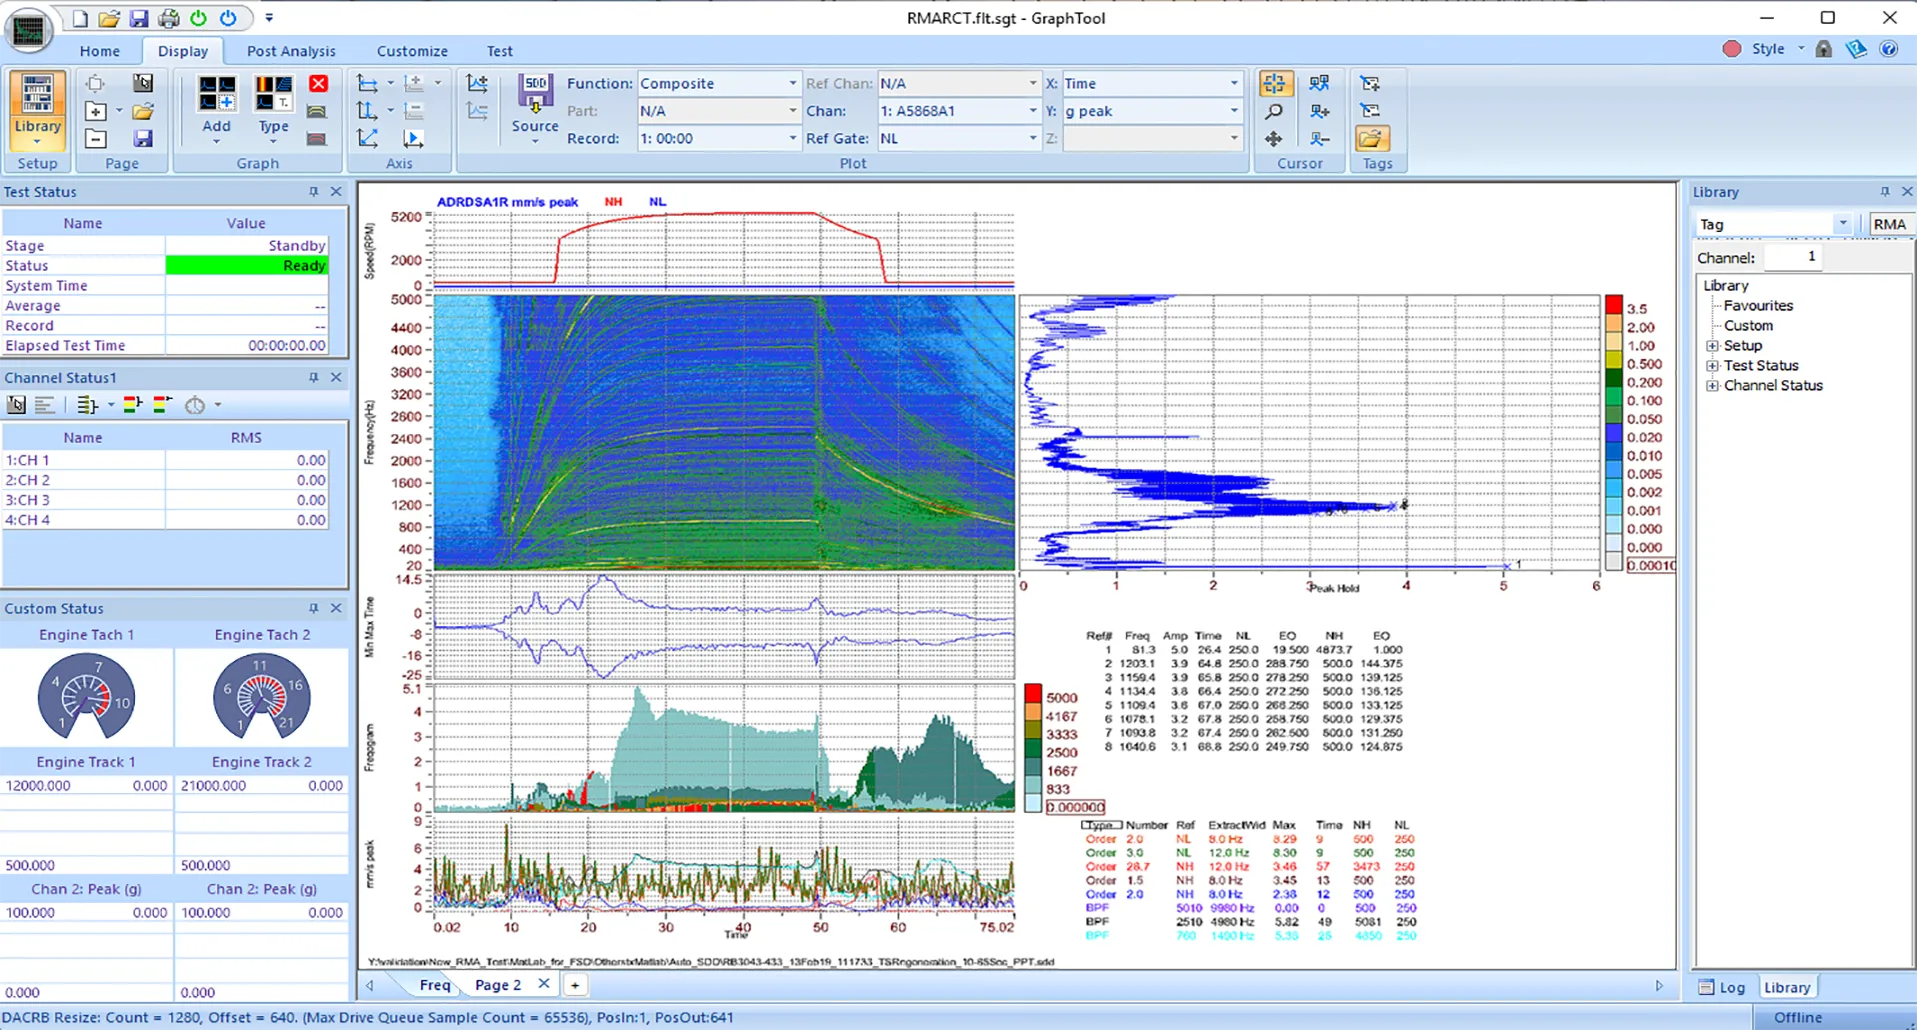
Spectral Dynamics invented closed-loop digital vibration control and continues to innovate with...
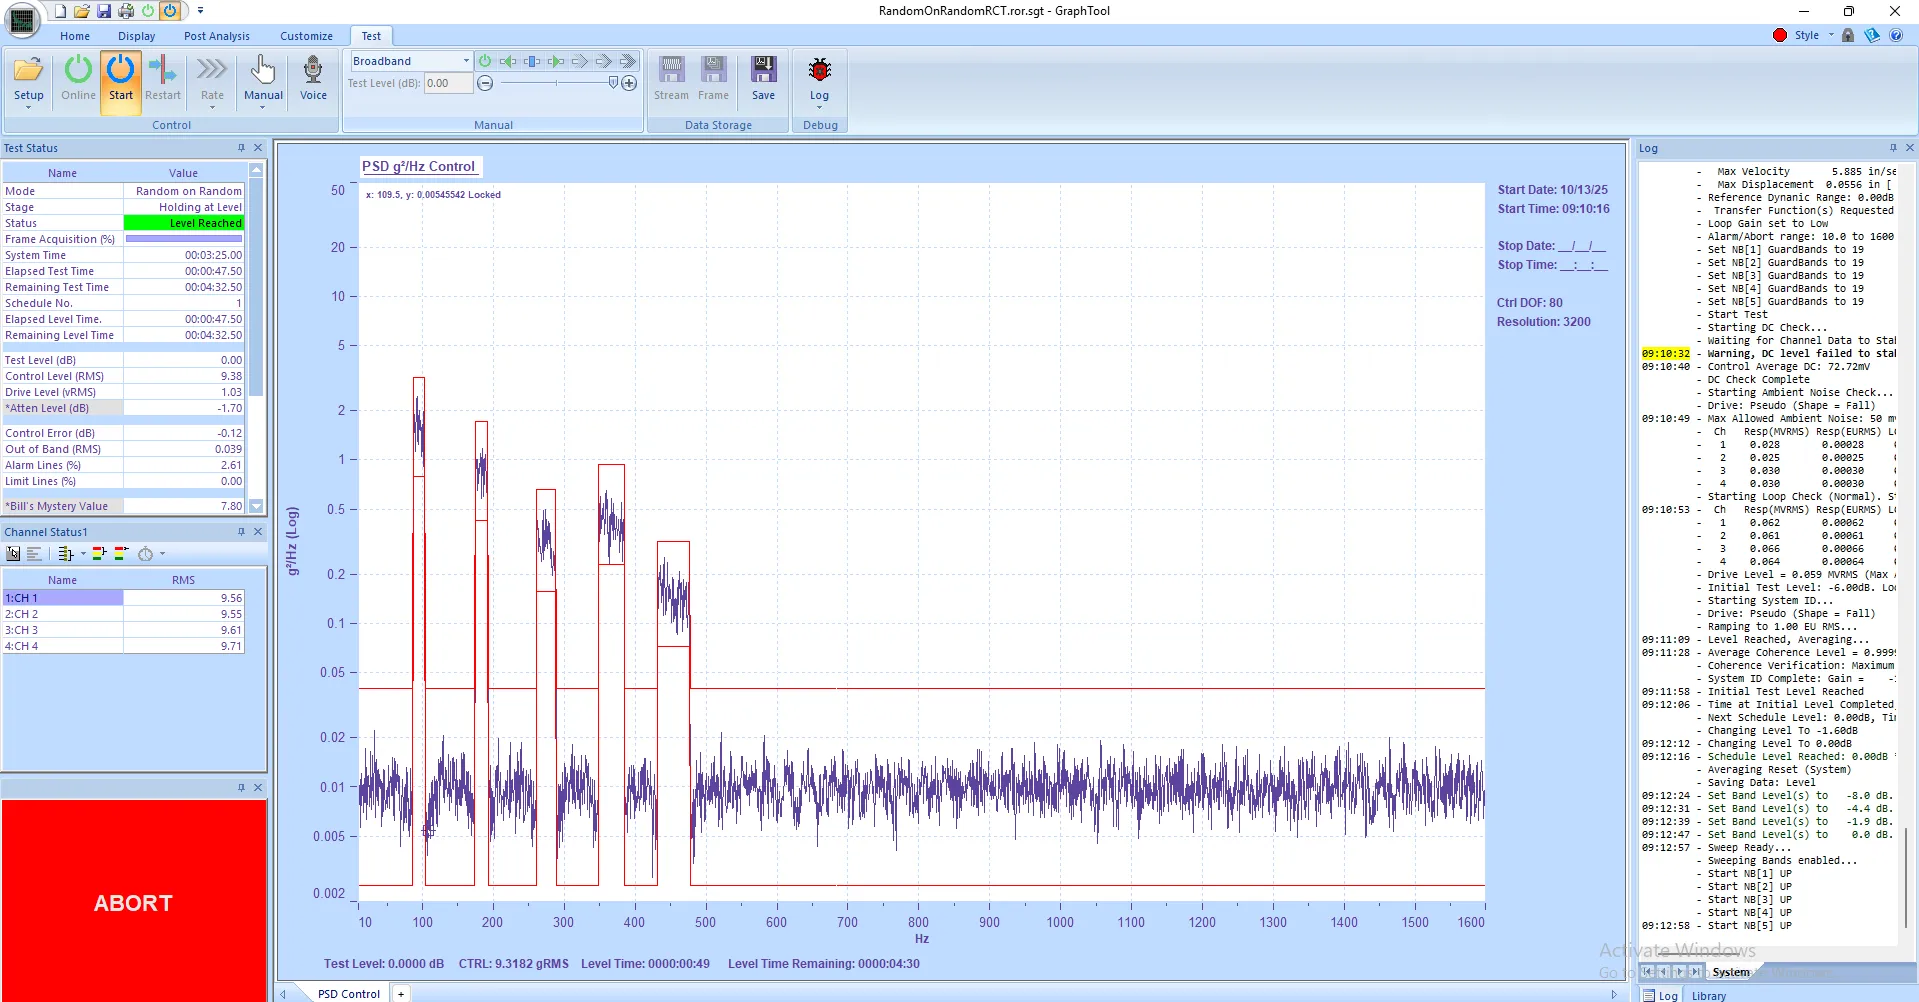
Panther Random on Random Control delivers precision and performance in multi-environment vibration...
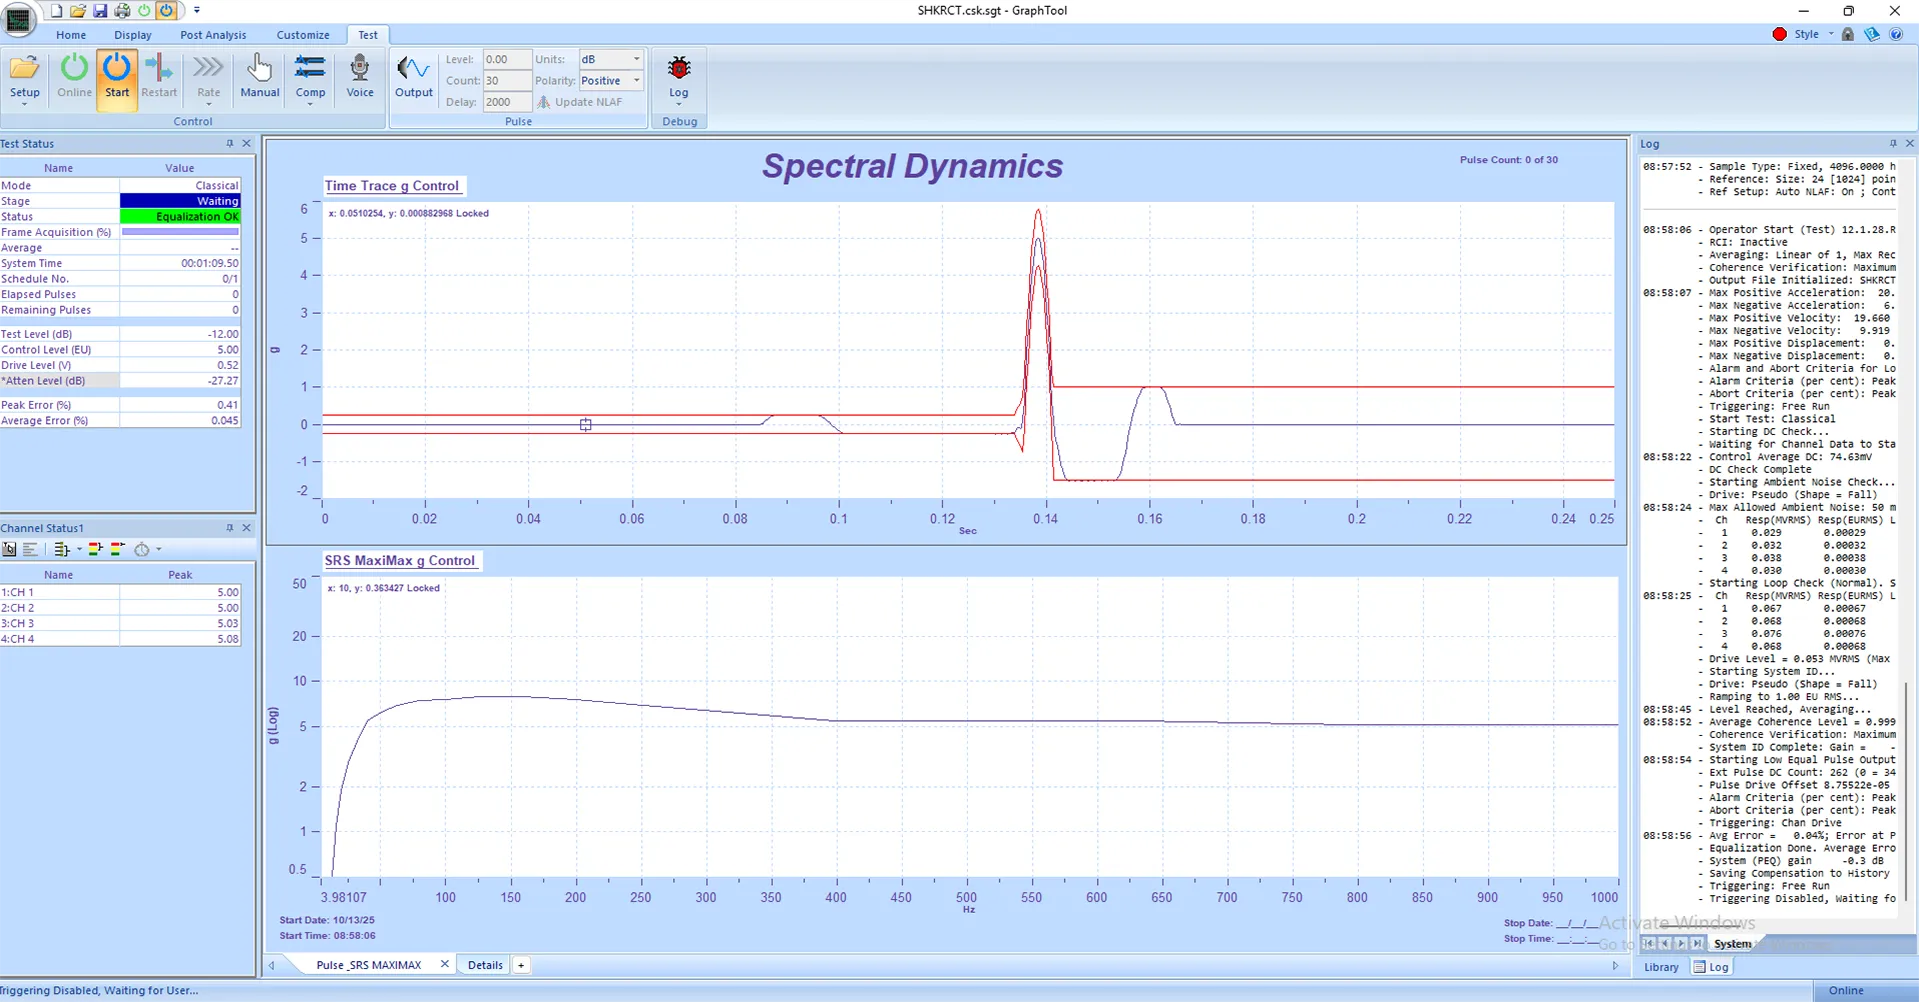
Panther Shock Control delivers precision and performance in transient vibration testing. Built on...
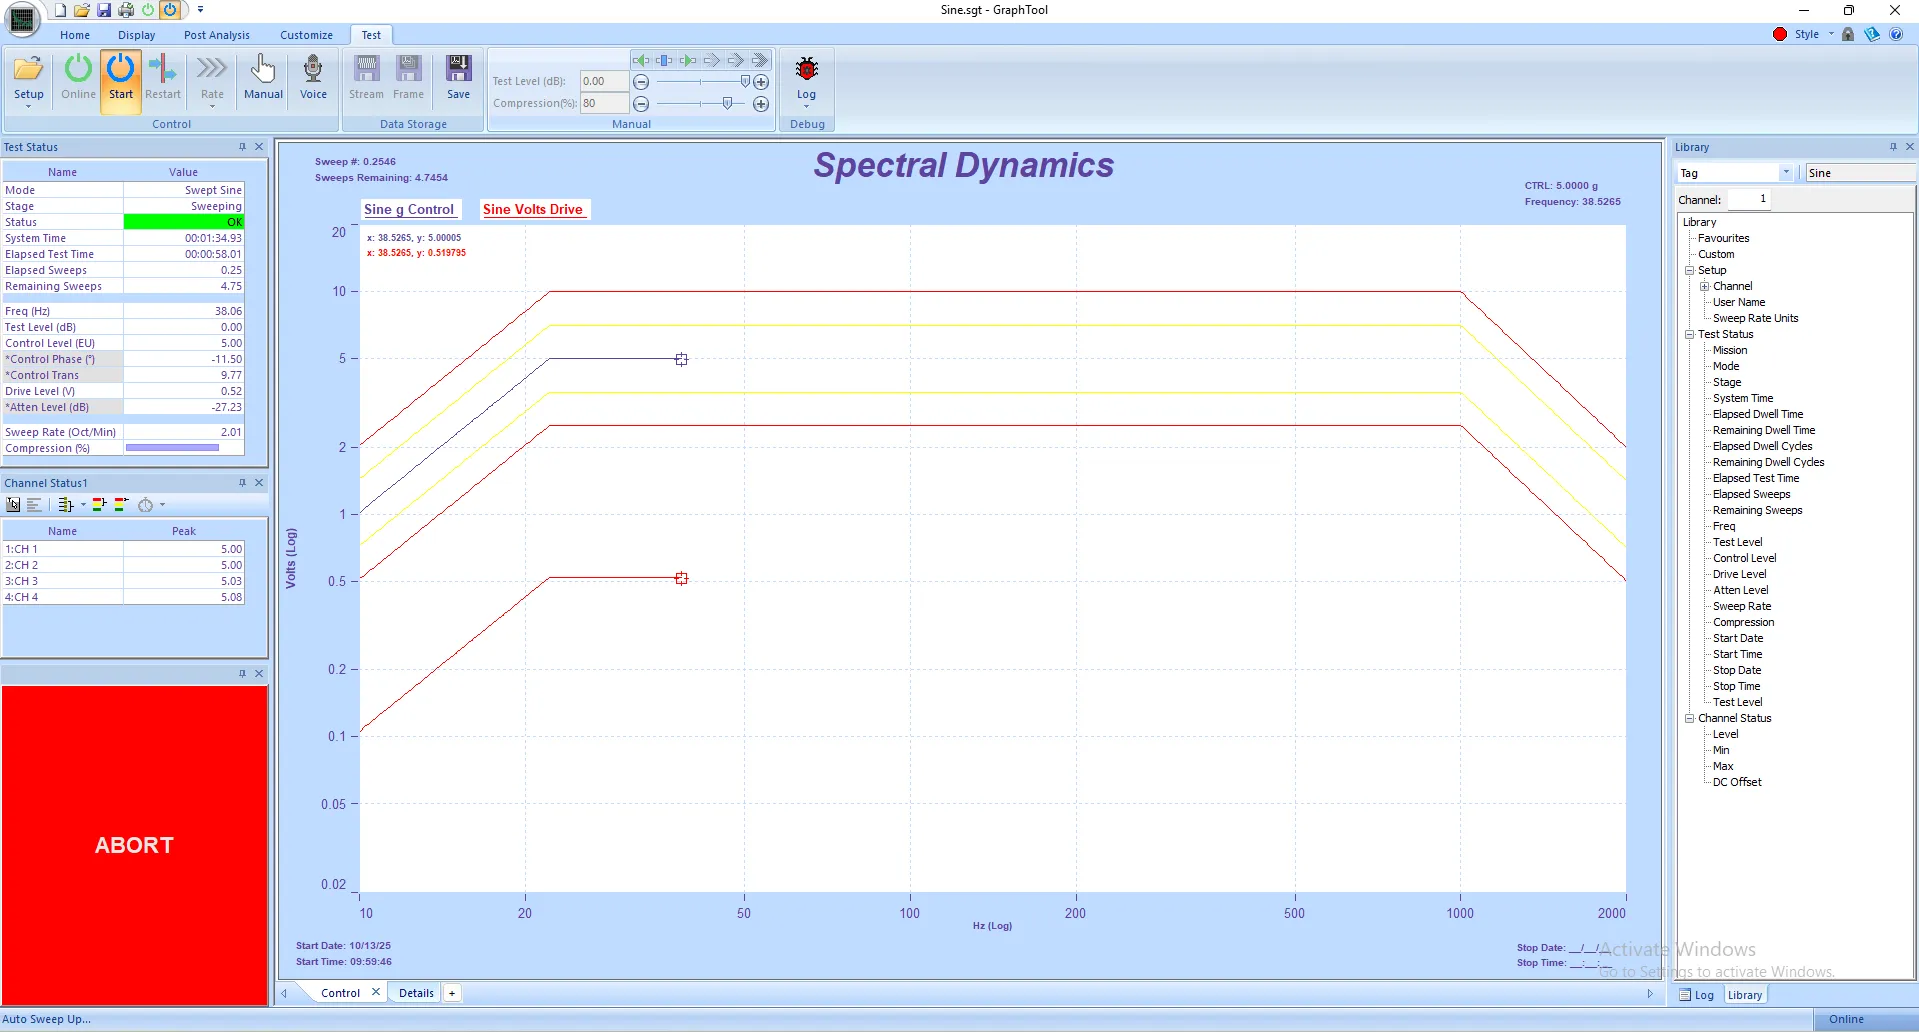
Panther Sine Control delivers unmatched precision and stability for both swept-sine and...
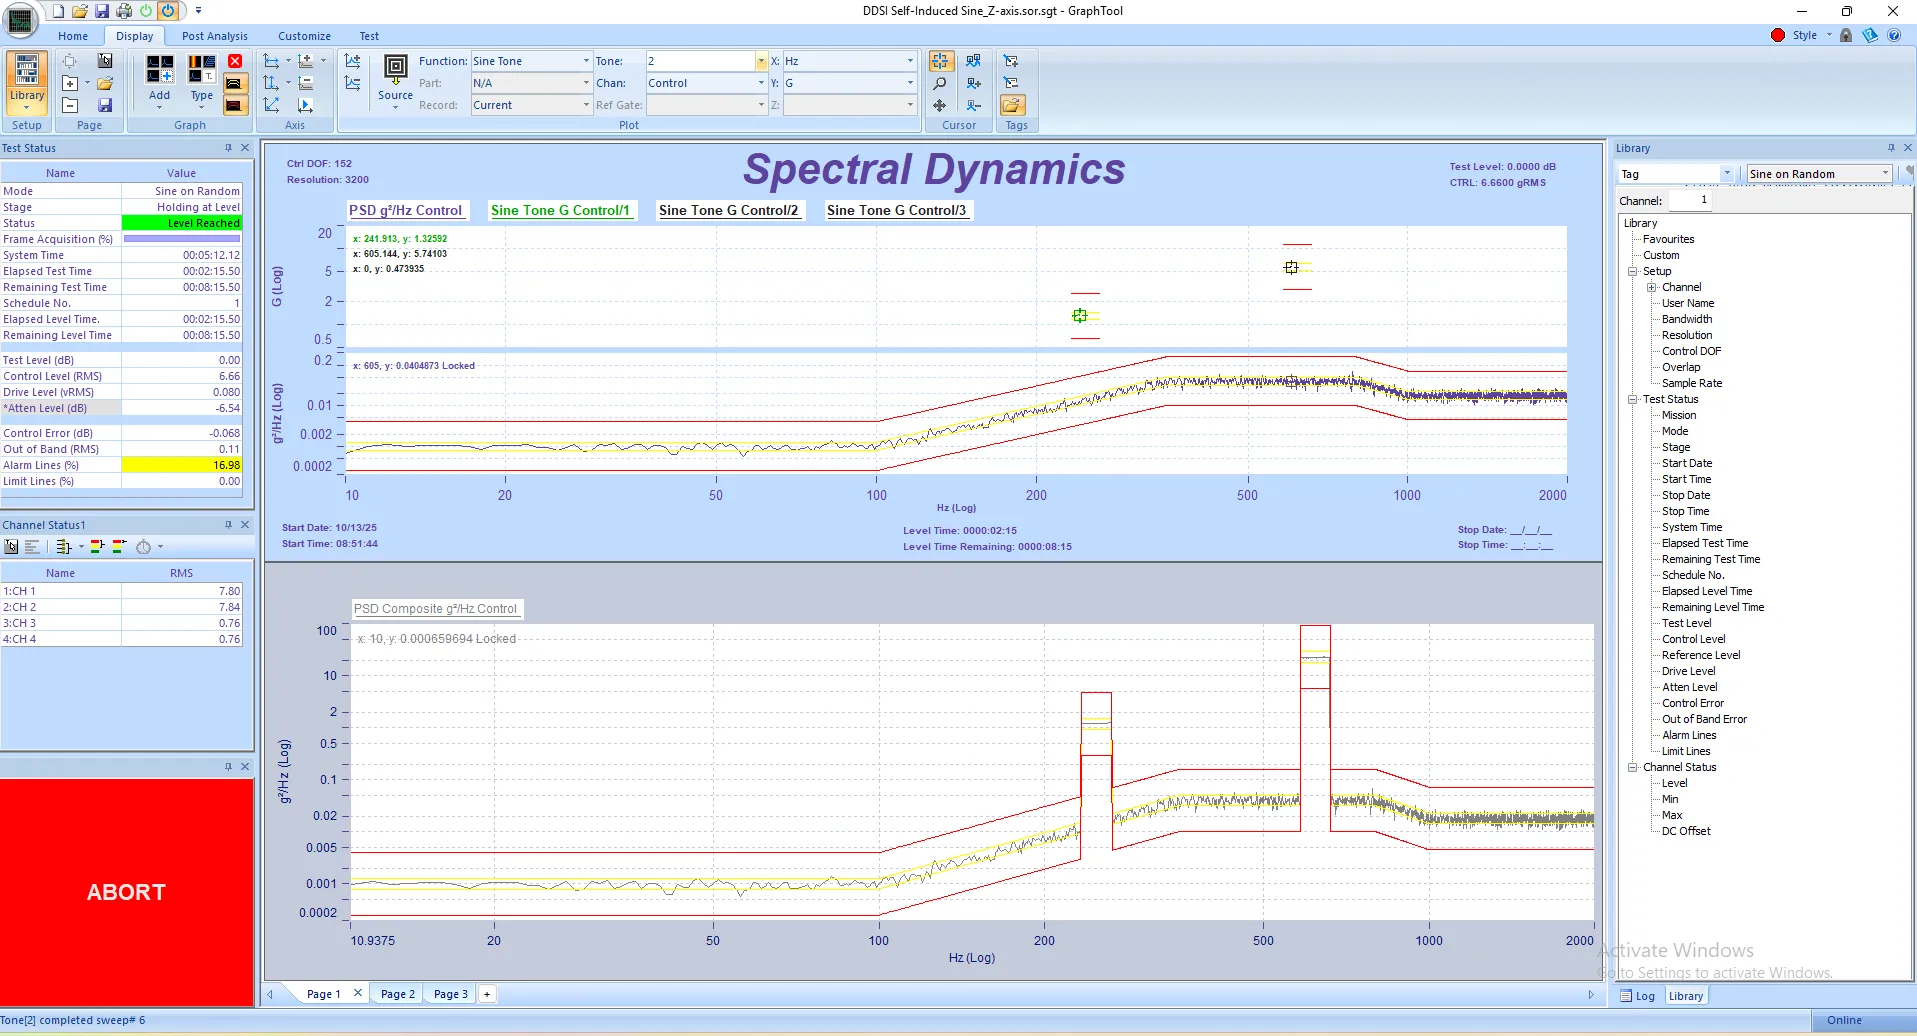
Panther Sine-on-Random Control delivers precision and performance in mixed-mode vibration testing....