Examples of Data Analysis for Rotating Machinery
Techniques and case studies in rotating machinery vibration analysis, including turbine, automotive, and compressor diagnostics.
1. Introduction
PC based time series data analysis systems are being applied with greater frequency to the analysis of problems with rotating machinery. A contemporary digital data analysis PC system, when coupled with vibration transducers such as eddy current displacement probes and piezo-electric accelerometers, can prove to be a powerful diagnostic tool.
Machinery defects can often be detected by correlation of frequency components proportional to RPM (harmonics or orders) with known "signatures" of typical malfunctions. In some cases, impending failures can be detected in advance of their occurrence by projection of trends of these frequency component amplitudes.
Three examples of the application of digital data analysis techniques are described in this paper.
- The analysis of vibration in gas and steam turbines.
- The analysis of noise and vibration in the passenger compartment during an automotive dynamometer test.
- The determination of valve defects in automotive air conditioning compressors.
The original data sets were obtained by recording the output of accelerometers, velocity pickups, strain gauges and microphones on analog magnetic tape. Optionally, one could also digitally record the data by direct A/D conversion onto digital storage devices. A Spectral Dynamics digital signal analysis system employing the Rotating Machinery Analysis application software (RMA) was utilized for the data acquisition and analysis. Several time series data analysis functions were computed and plotted. These include:
- Power Spectral Density Function
- Time Spectral Map
- RPM Spectral Map
- Time Order Track
- RPM Order Track
- Frequency Track
- Process Lines
- Color Spectrograms
- Campbell Diagram
The objective of this paper is tutorial to illustrate the use of such computational devices. The features of the displays of these functions are related to physical characteristics of the machinery. It is expected that the examples shown will motivate the appreciation of the techniques and establish the usefulness of digital signal analysis for problems in rotating machinery.
2. Hardware and Software Used for Rotating Machinery Data Analysis
The Panther hardware utilized in the analysis consists of an analog to digital converter subsystem coupled to a PC. In a typical configuration up to 32 vibration and RPM signals may simultaneously be input to the A/D subsystem. If required, speed signals can be input through addition of a timer/counter unit interfaced to the Panther. The timer/counter units can handle RPM signals to 100,000 hertz. Multiple speed inputs are useful in analyzing complex systems such as gear drives wherein multiple shafts are rotating at different rates. The software system has multiple storage options including a stream to disk function for very fast transient tracking. The stream files can easily be utilized as a data source and processed the same as would be done for real time source inputs.
The software RMA package is configured via a few simple dialogs. The hardware configuration dialog is utilized to set the Input data source to be analyzed.

If the data is to be acquired and processed in real time, then there are additional dialogs to define the various input data channel configurations, the Gates (Speed, Rpm, frequency and time) which are utilized to provide additional system information during acquisition and processing.
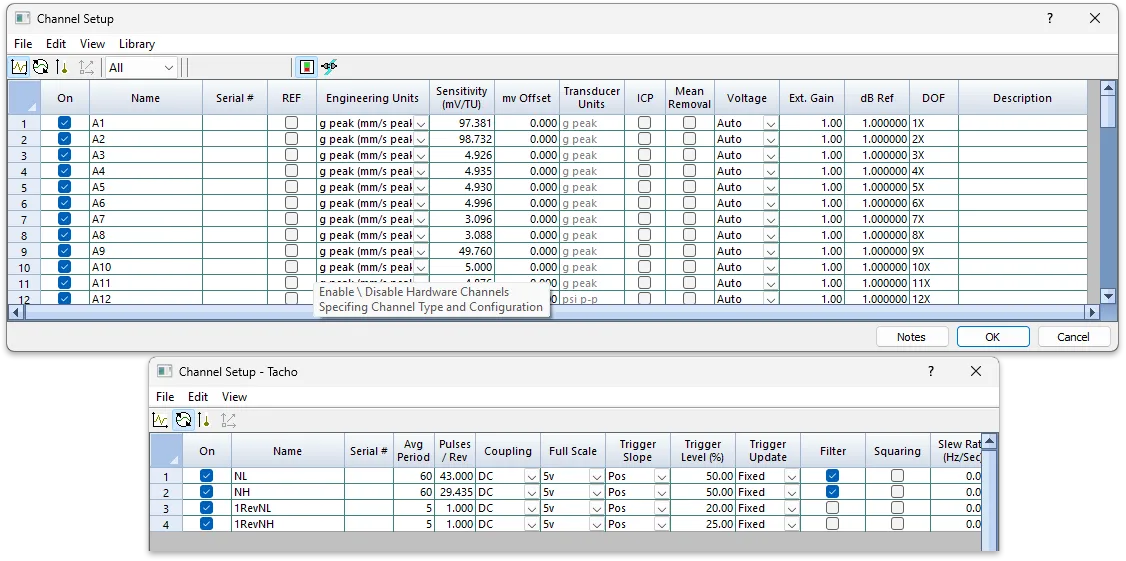
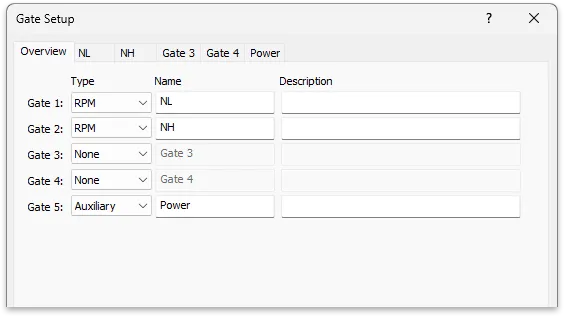
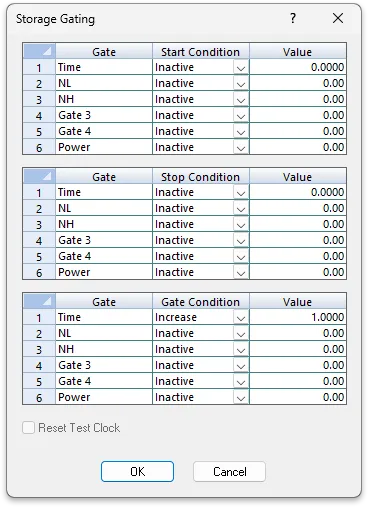
There are also dialogs to describe what, when and where collected data is to be stored (Streamed and/or frame based gated storage options).

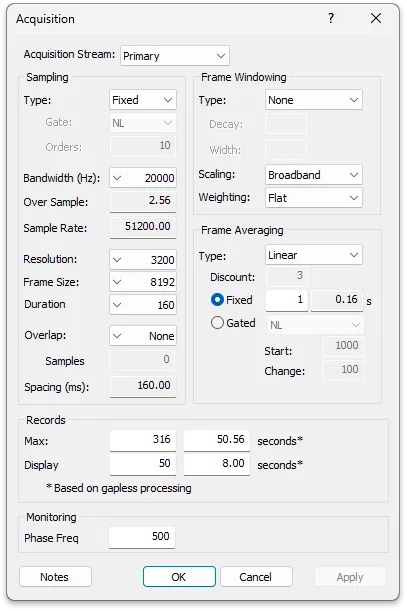
Data acquisition parameters are also entered including bandwidth, frame size, averaging type and count (if required), as well as total test duration to capture in time or records.
Processing of data can optionally be Gate controlled via the user defined Gate parameters such as Time, Rpm, Speed, or any other user defined dynamic gate value.
Finally, as with most other Spectral Dynamics products, there are additional options for defining Process Lines for focused analysis functions that can be logged or tagged for parameter tracking as well as a source for real time alarm and abort functions.


3. Data Examples for Rotating Machinery Analysis
In this section the results of data analysis on three data sets from rotating machinery will be described. The data sets are:
1 Vibration measurements from gas and steam turbines.
2 Accelerometer and microphone measurements from the passenger compartment of an automobile.
3 Accelerometer, microphone, and air pressure measurements from automotive air conditioning compressors.
For all three examples, RPM was varied. In the first case involving two turbine examples there was both a powered run-up and a rundown. One involved a powered run-up while in the other, the turbine was tripped and it was allowed to coast down. In the second case, the engine was run-up from low to high RPM. In the third case, the equipment was run at a constant low RPM, swept up slowly to a high RPM and then constant again. In the third case, the equipment was run at a constant low RPM, swept up slowly to a high RPM and run constant again at high RPM.
In the case of the steam turbine, we were also able to relate the data analysis results to characteristics of the turbine. In the automotive acoustic case, we analyzed the characteristics of this type of data.
We were able to illustrate the detection of specific mechanical defects for the compressor data. However, we must keep in mind that we are only showing single examples, and the sample was too small to draw statistical conclusions.
Click Icon for Full Screen or Esc to Return
3.1 Turbine Vibration Analysis Application
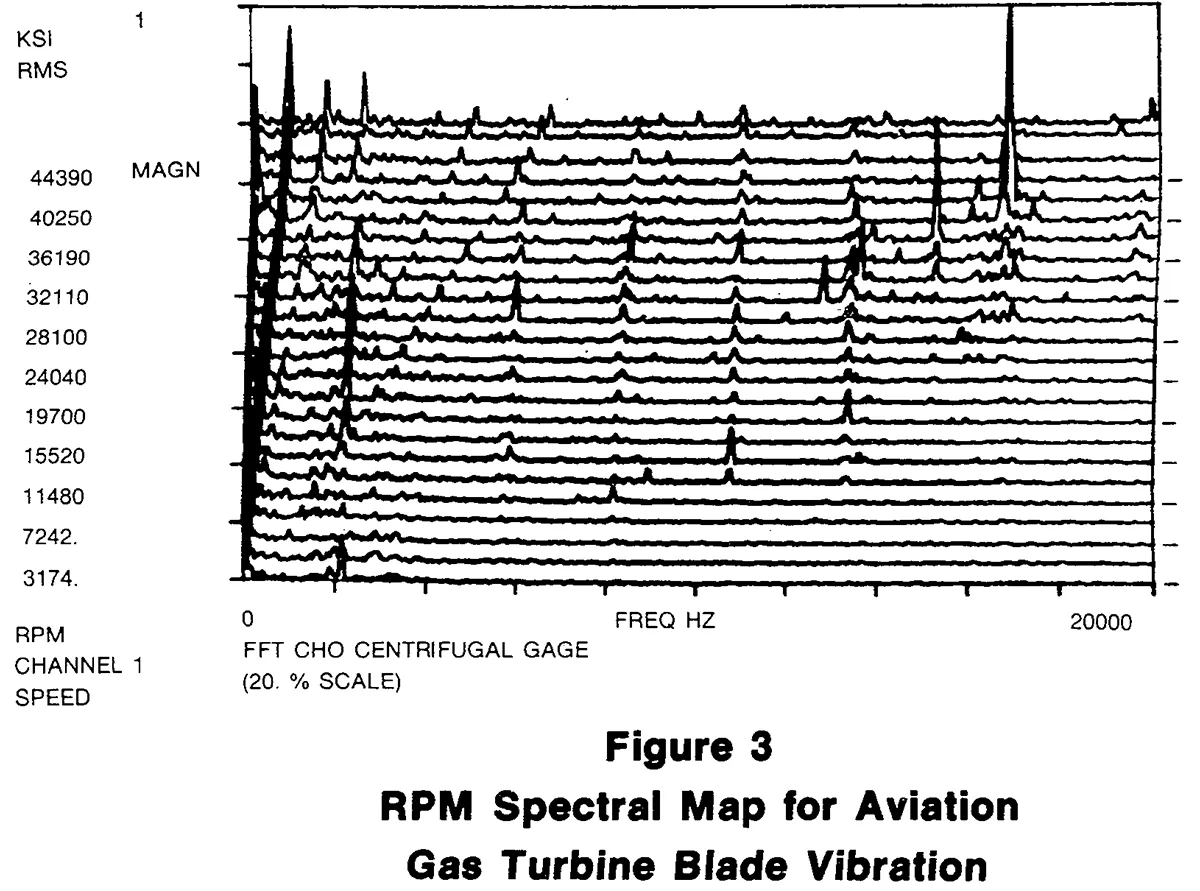
We will now present two applications of turbine vibration data analysis. In the first example we will examine data from the compressor blades on an aviation gas turbine. In this application the SIGNAP package was used to verify the design of the turbine blading. A test turbine was instrumented with strain gauges on the rotating compressor blades. The turbine was run through its operating RPM range (0-50000 RPM) and the strain gauge and RPM data was then digitized, analyzed and made ready for display. The first display a user will frequently select is either the RPM Time Spectral or RPM Order Spectral, particularly if one does not have foreknowledge of the character of the data. In this plot, frequency or engine order is on the X axis, spectral amplitude on the Y axis, and RPM or time axis is also on the Y axis. This display format allows the engineer to quickly scan the data to identify areas of interest.
In Figure 3 we can see that there is considerable activity at the low end of the frequency range (0-1000 Hz) for which the maximum amplitude is around 1000 psi. We can also see several vertical rows of peaks (at approximately 2100, 5800, 8000, 10800, and 13500 Hz) which may be blade vibration modes being excited. Finally, at higher RPM's (above 36000) we can see one of the higher harmonics producing a signal in excess of 3000 psi.
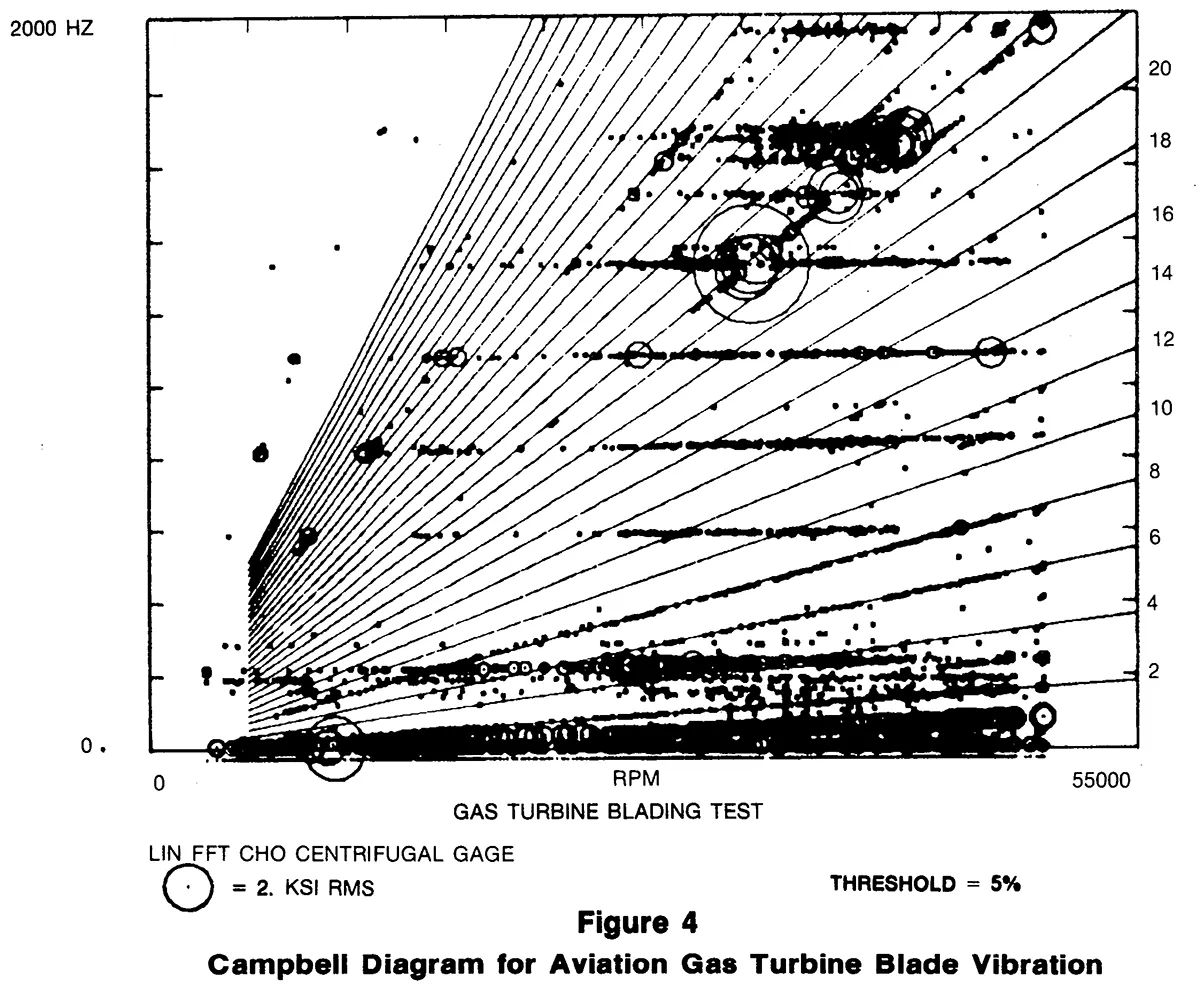
The Campbell diagram shown in Figure 4 provides perhaps the most effective presentation for this type of data, wherein discrete vibration modes are excited by various harmonics of the running speed of the machine as the speed is varied. In the Campbell diagram for the gas turbine blading test, one can identify at least nine modes. In general, it is possible to distinguish resonant response frequencies from background noise by observing that the resonant modes reach their largest amplitudes on harmonic lines. It can also be noted that certain harmonics, such as the 24th and the 40th, give rise to a much higher level of response than others. When this occurs in turbines at the higher orders, it generally can be explained by disturbances in the flow path upstream such as radial struts or stationary vanes.
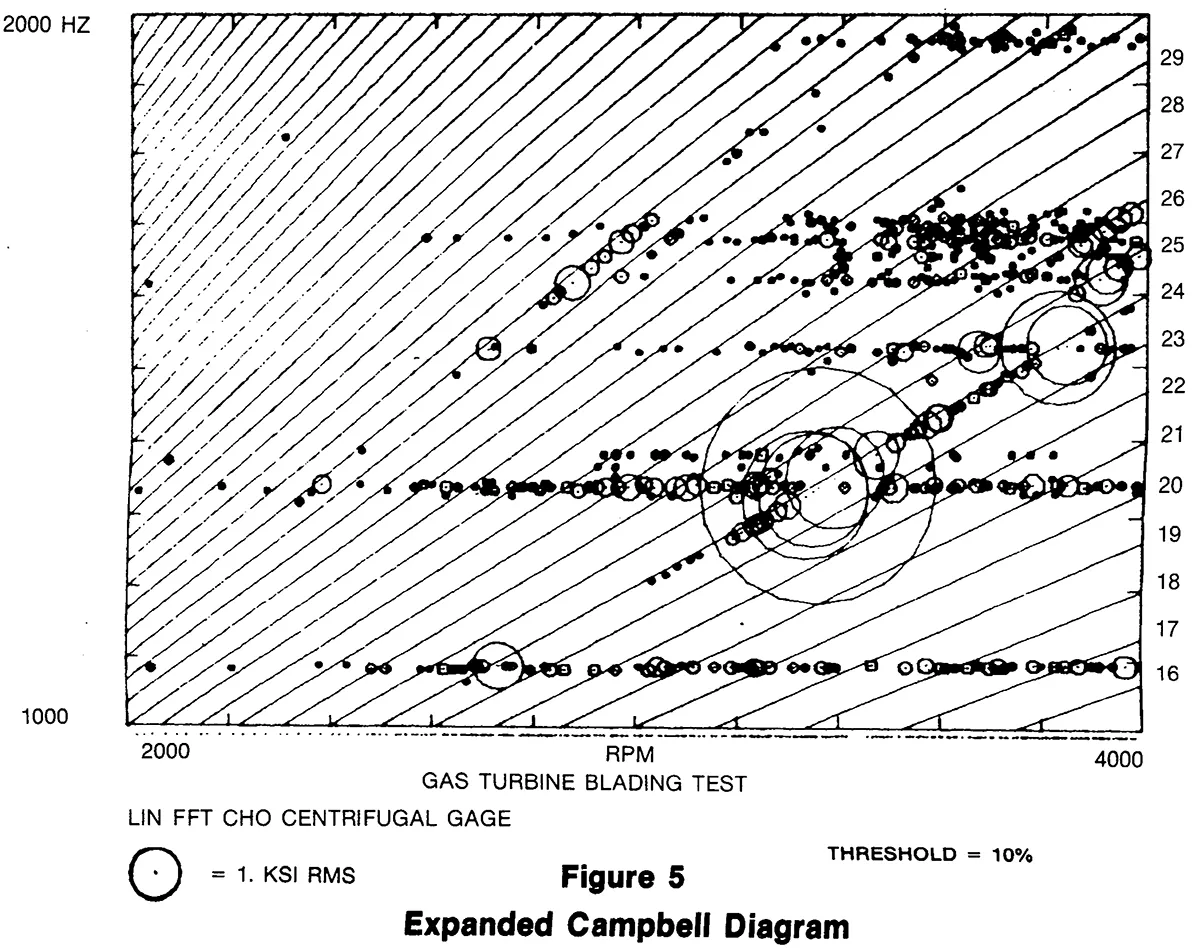
A more detailed view of the activity in a region of interest can be obtained by expanding the RPM and/or frequency range of the plot. For example, one may wish to examine a specific mode and adjust the display parameters to enhance it for viewing at maximum clarity. This is demonstrated in Figure 5. A list of the frequencies, frequencies and harmonic orders of all peaks can also be obtained if more precise quantitative information is required.
The data on these plots can be used by the turbine designer to verify the design and/or the analytical models of the structure. In particular, the designer can determine whether blade resonances are excited under normal operating conditions. It is inevitable that turbine blades will resonate at some frequencies, and it is not usually possible to provide adequate damping for all modes. A moderate damped resonant peak may be acceptable if it occurs at an RPM at which continuous operation for long periods of time is not required. If, however, the Campbell diagram indicates that a resonance is likely to be excited at cruising RPM, it will be necessary for the blade design to be modified either to increase the damping, reduce the excitation, or retune the resonant frequency. The cost of making the necessary modifications and retesting may be high, but the cost of repairing a field blade-failure in a turbine can be much higher.
The second application of turbine vibration analysis to be discussed deals with bearing vibration on a large central station steam-turbine generator set. In this case the signature analysis software package was used to monitor the health of an operating machine with a view towards identifying problems before they result in catastrophic failure. To establish a baseline for machinery health monitoring, it is necessary to identify vibration signatures for the equipment in question. These vibration signatures can be displayed in several formats including: power spectra, power spectra normalized to machine speed (i.e. order spectra plotted with respect to engine orders rather than frequency) or order tracks. Order plots have been found to be particularly useful in diagnosing bearing vibration problems. By plotting the amplitudes of a few critical orders over the RPM operating range, one can identify the most common vibration problems. An RPM order track of the first harmonic (Figure 6) for a bearing-mounted velocity probe gives a clear presentation of the static unbalance of the rotor system.
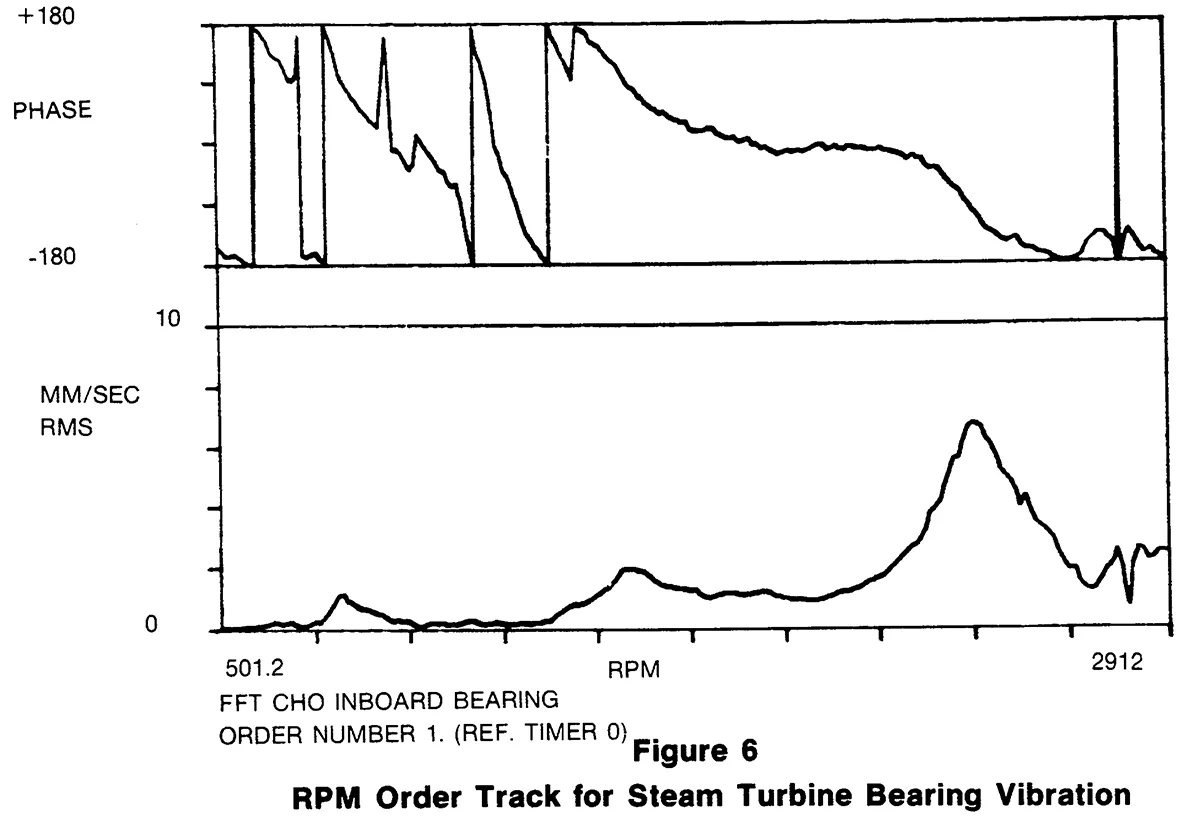
The first major critical speed of the rotor can be seen to occur at 2440 RPM. The phase angle plotted above the magnitude in the figure is referenced to a one-per-revolution pulse on the tachometer, and can be used in the balancing process. RPM order tracks of other orders may also be produced. For example, for systems it may be sufficient to plot only the first four orders, for others it may be advisable to track blade or gear passing frequencies as well. At regular intervals, new order tracks can be produced and compared to the baseline values. If major changes occur in any of the order tracks, the operator should suspect that some degradation in machine operation has taken place. A sufficient increase in the level of first harmonic generally signals that the machine has become unbalanced. Increase in vibration at the second harmonic may indicate a bent shaft, coupling mis-alignment or loose parts on the structure. With the acquisition of a data base sufficient to characterize performance limits for the various orders, the detection process can be automated.
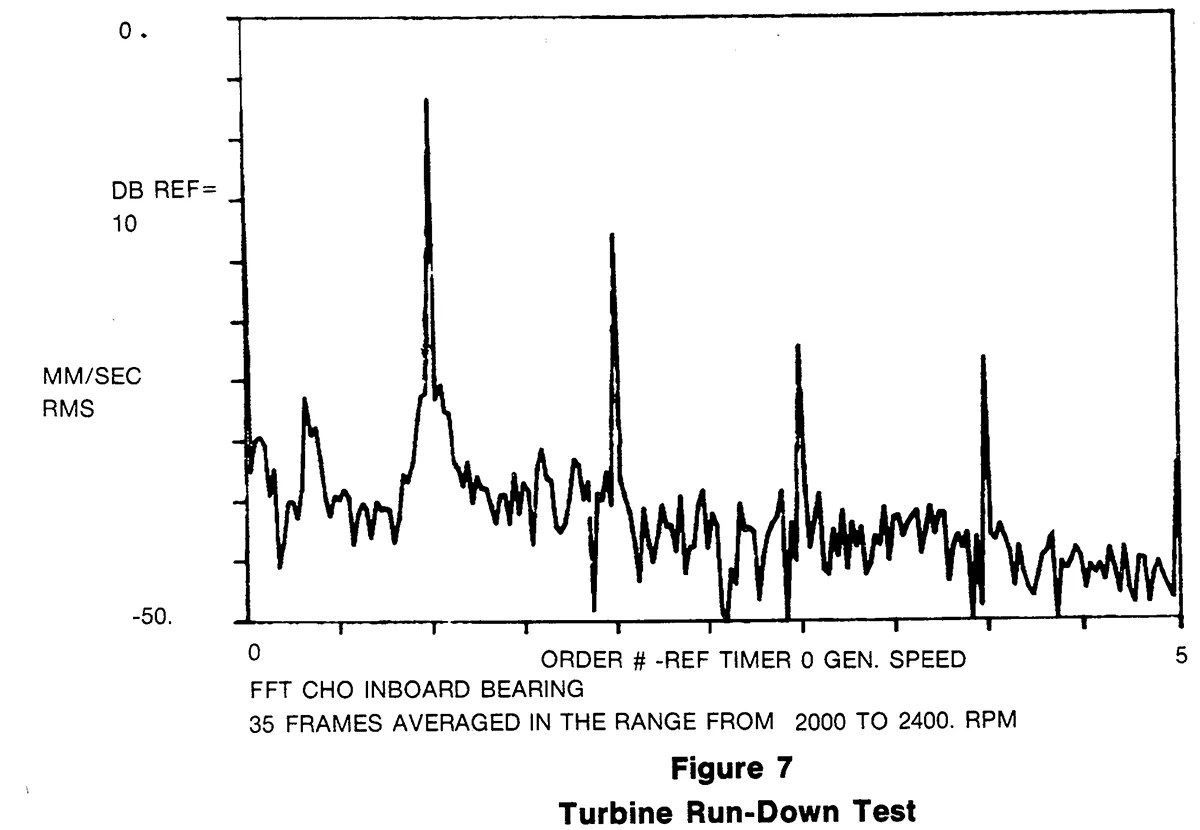
Figure 7 is a display of the Fourier transform magnitude averaged from 2000 to 2400 RPM. The abscissa is order numbers rather than frequency and one can easily see the first four orders.
3.2 Automotive Acoustic and Vibration Analysis Application
Automotive manufacturers are particularly concerned with minimizing noise and vibration levels in the passenger compartments of their products. Spectral Dynamics had installed a system for an auto manufacturer which acquires data from up to 32 channels of accelerometers and microphones, and up to 32 channels of low speed data (sound level meters, etc.), and a 1/3 octave band analyzer. The data from all channels is acquired and stored on a disk simultaneously as the test car is put into gear and accelerated to maximum RPM on a dynamometer test stand in a semi-anechoic chamber.
As the ultimate function of this system is to aid the manufacturer in minimizing noise levels, the displays are oriented towards acoustic measurements. A and/or B-weighted sound pressure levels are plotted with respect to engine RPM, vehicle speed, or time. The A-weighted level, which approximates the sensitivity of the human ear, can be used as a quantitative figure of merit for quietness. The A-weighted values for the test vehicles can be readily compared to the overall noise level acceptance criteria.
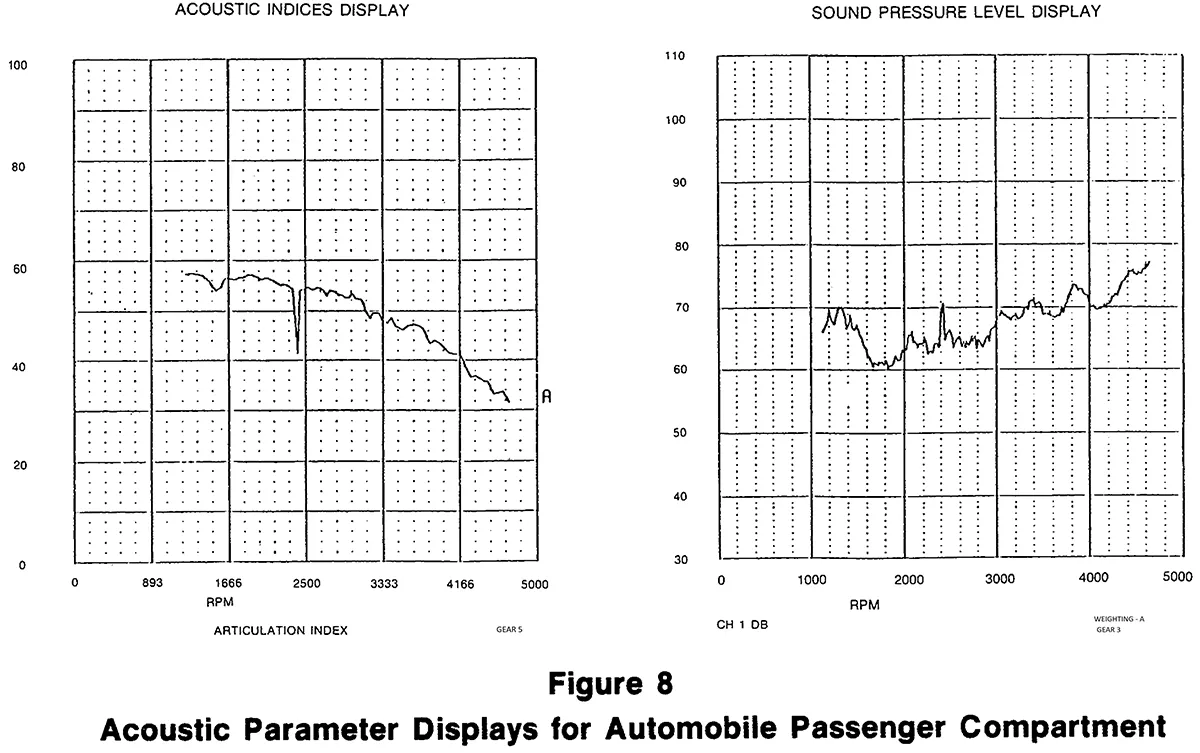
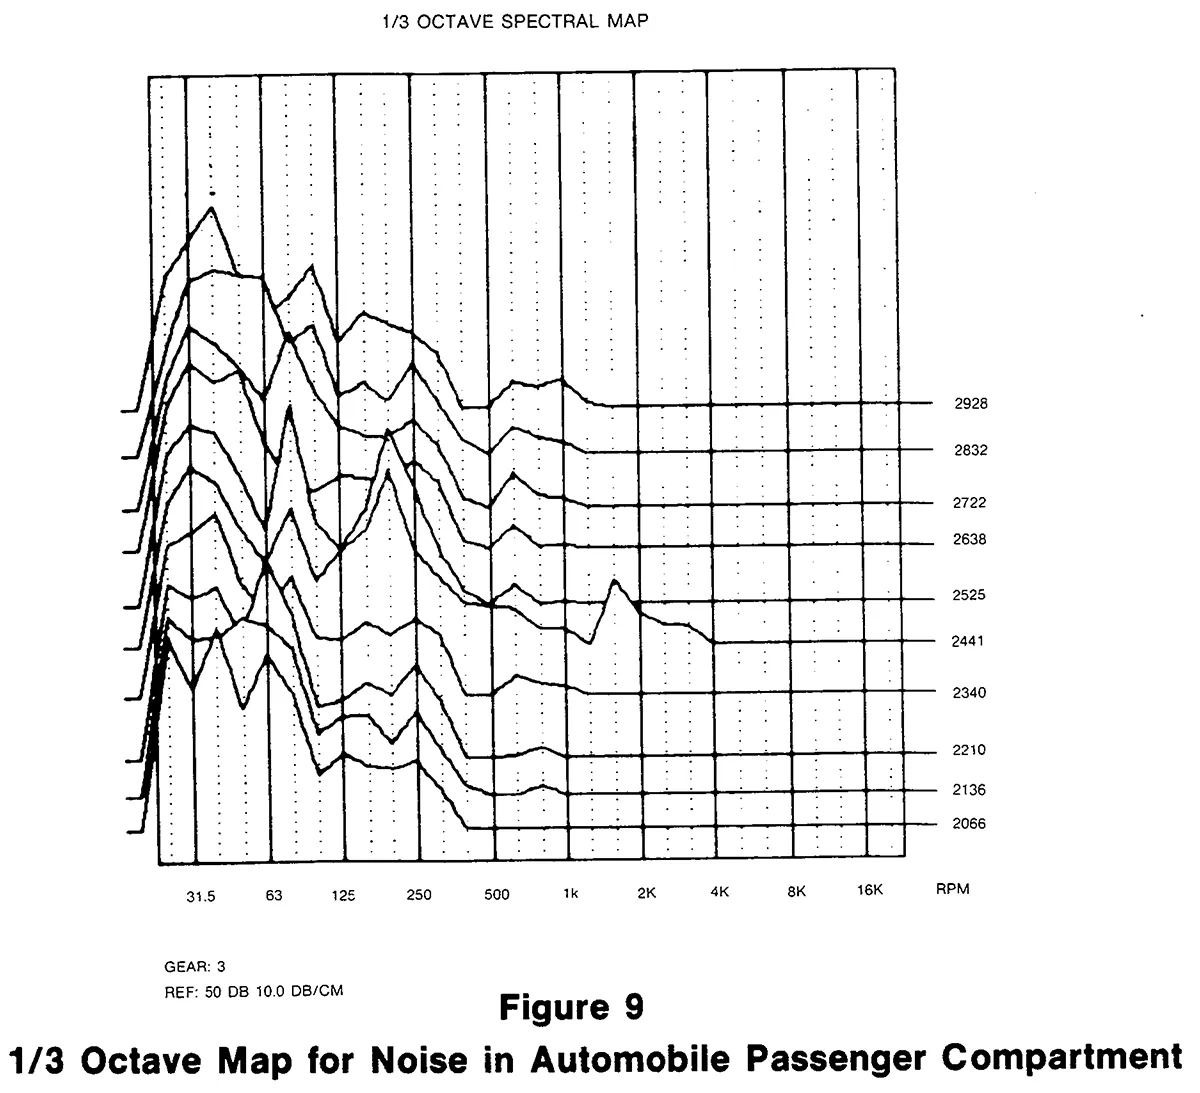
Other acoustic indices may be plotted. One of these is the articulation index, which provides a measure of how easy it is to make oneself understood in a noisy environment. In the example plot of these parameters in Figure 8, a perturbation can be observed in both plots at about 4400 RPM. Further investigation can be accomplished using the 1/3 octave Spectral Map shown in Figure 9. This display, which is analogous to the narrowband spectral map described earlier, indicates that the disturbance was probably caused by noise in the frequency range of 1.6 to 2K.
This system also produces narrowband spectral displays and maps, and order tracks in formats similar to those described above. With these tools the engineer can examine in detail specific areas of interest and identify sources of noise and vibration. Hard copies of the various plots may be made on an electrostatic printer plotter for inclusion in test reports. This system is expected to greatly aid the manufacturer to reach his goal of producing quieter and more comfortable cars.
3.3 Air Conditioning Compressor Vibration Analysis Application
Air conditioning compressors were constructed with various specific defects which were occasionally found in manufactured units. These compressors were tested and the results compared with data obtained from known good compressors. The test parameters were:
Transducers: Accelerometer
Microphone
Pressure Transducer
RPM: 20 seconds at 1500 RPM
20 seconds run up 1500-3000 RPM
20 seconds at 3000 RPM
Frequency Bandwidth: 2000 Hz
Sampling Rate: Sr = 5120
Data Frame Size: NS = 1024 points
Frame Time Period: Pr = .2 sec
Frequency Resolution: b = .5 Hz
Microphone Data
Figures 10(a), 10(b) and 10(c) are the microphone spectral signatures at 3000 RPM of three good compressors. (Note, we are only concerned with relative amplitude levels at this time and are rarely concerned about the actual physical units of the data. In production use of techniques, we would have to carefully calibrate in order to ensure that results from different days and months could be properly compared.) The harmonic structure of the data is apparent. This can be seen by noting the spectral maps at multiples of 50 Hz (which corresponds to 3000 RPM).
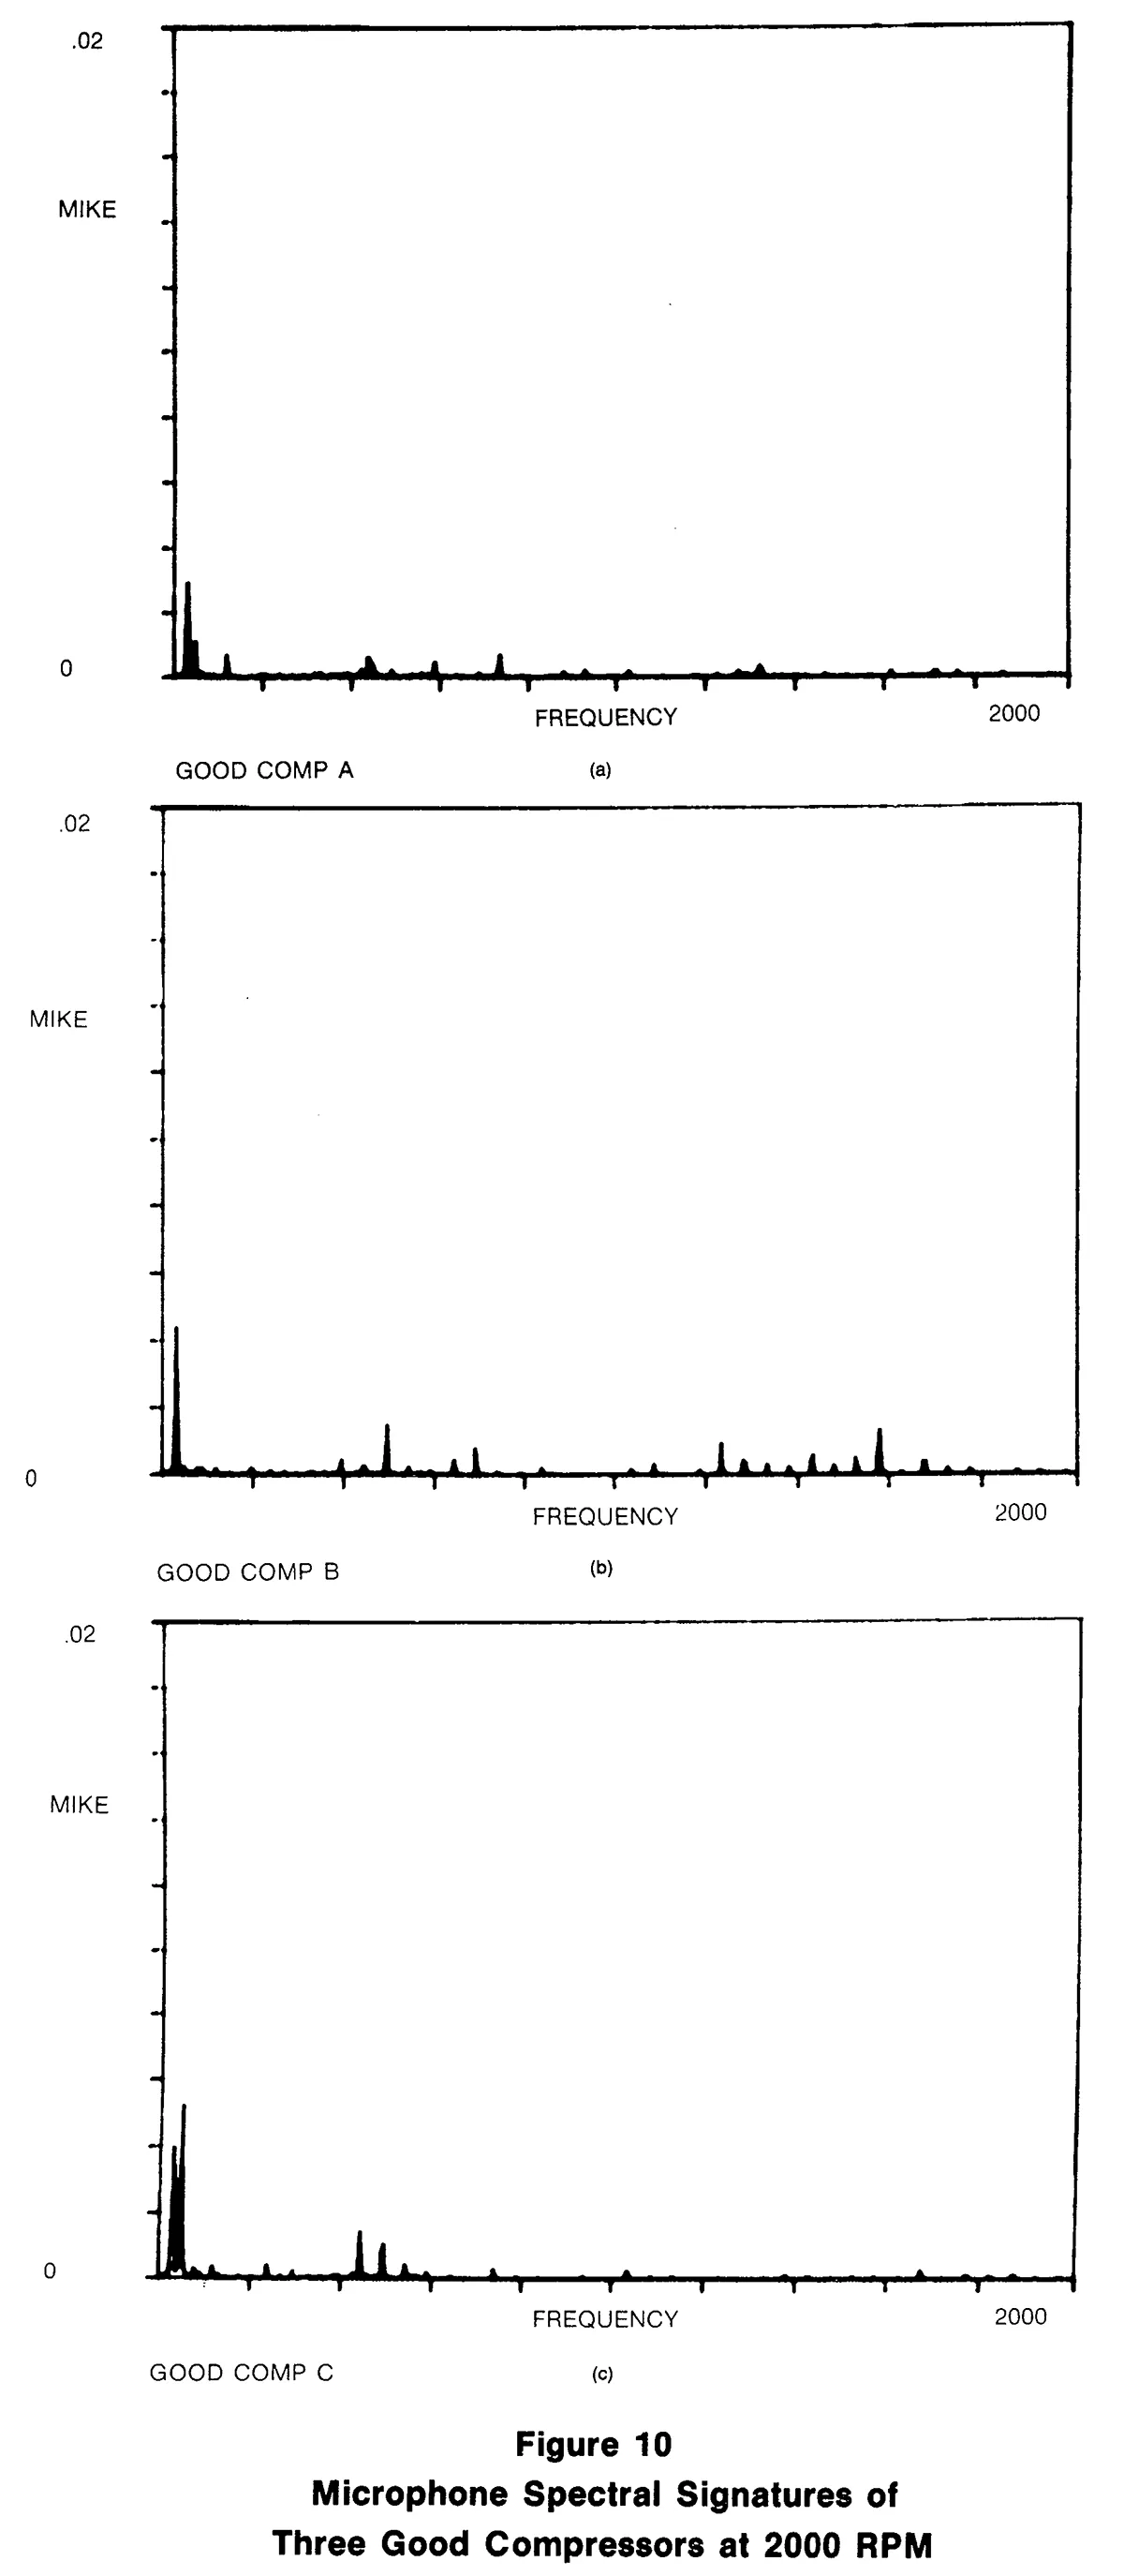
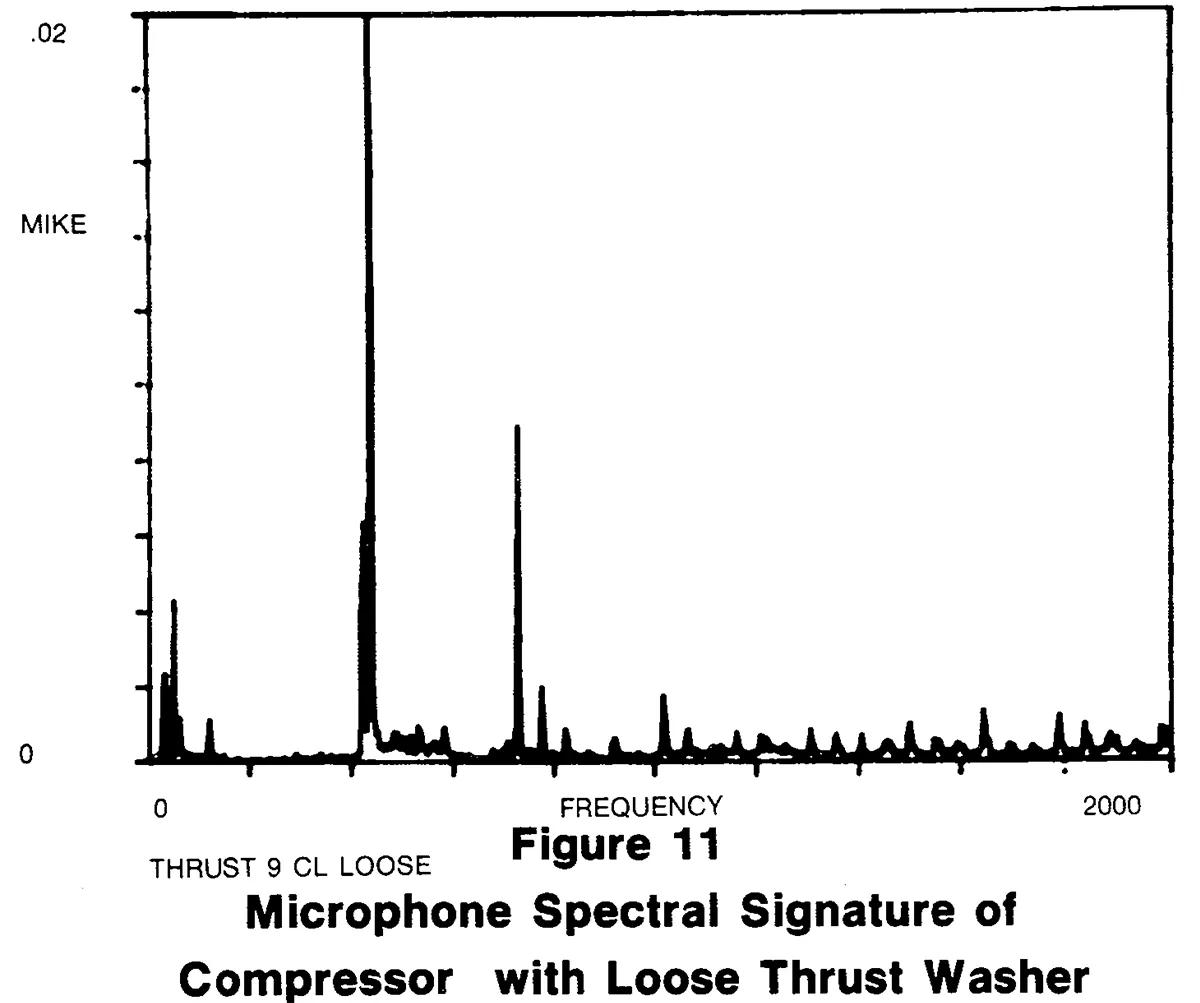
Figure 11 is the 3000 RPM microphone spectral signature of a defective compressor. The defect in this case is an excessively thin thrust washer allowing axial movement of a rotating shaft. The spectrum is obviously different from the good signatures. In particular, the 9th harmonic (order) exceeds the good "base-line" by a factor of about 5 to 10.
Acceleration Data
Figures 12(a), 12(b) and 12(c) are the 3000 RPM spectral signatures of the same three compressors. The harmonic structure is again apparent, more so at higher frequency.
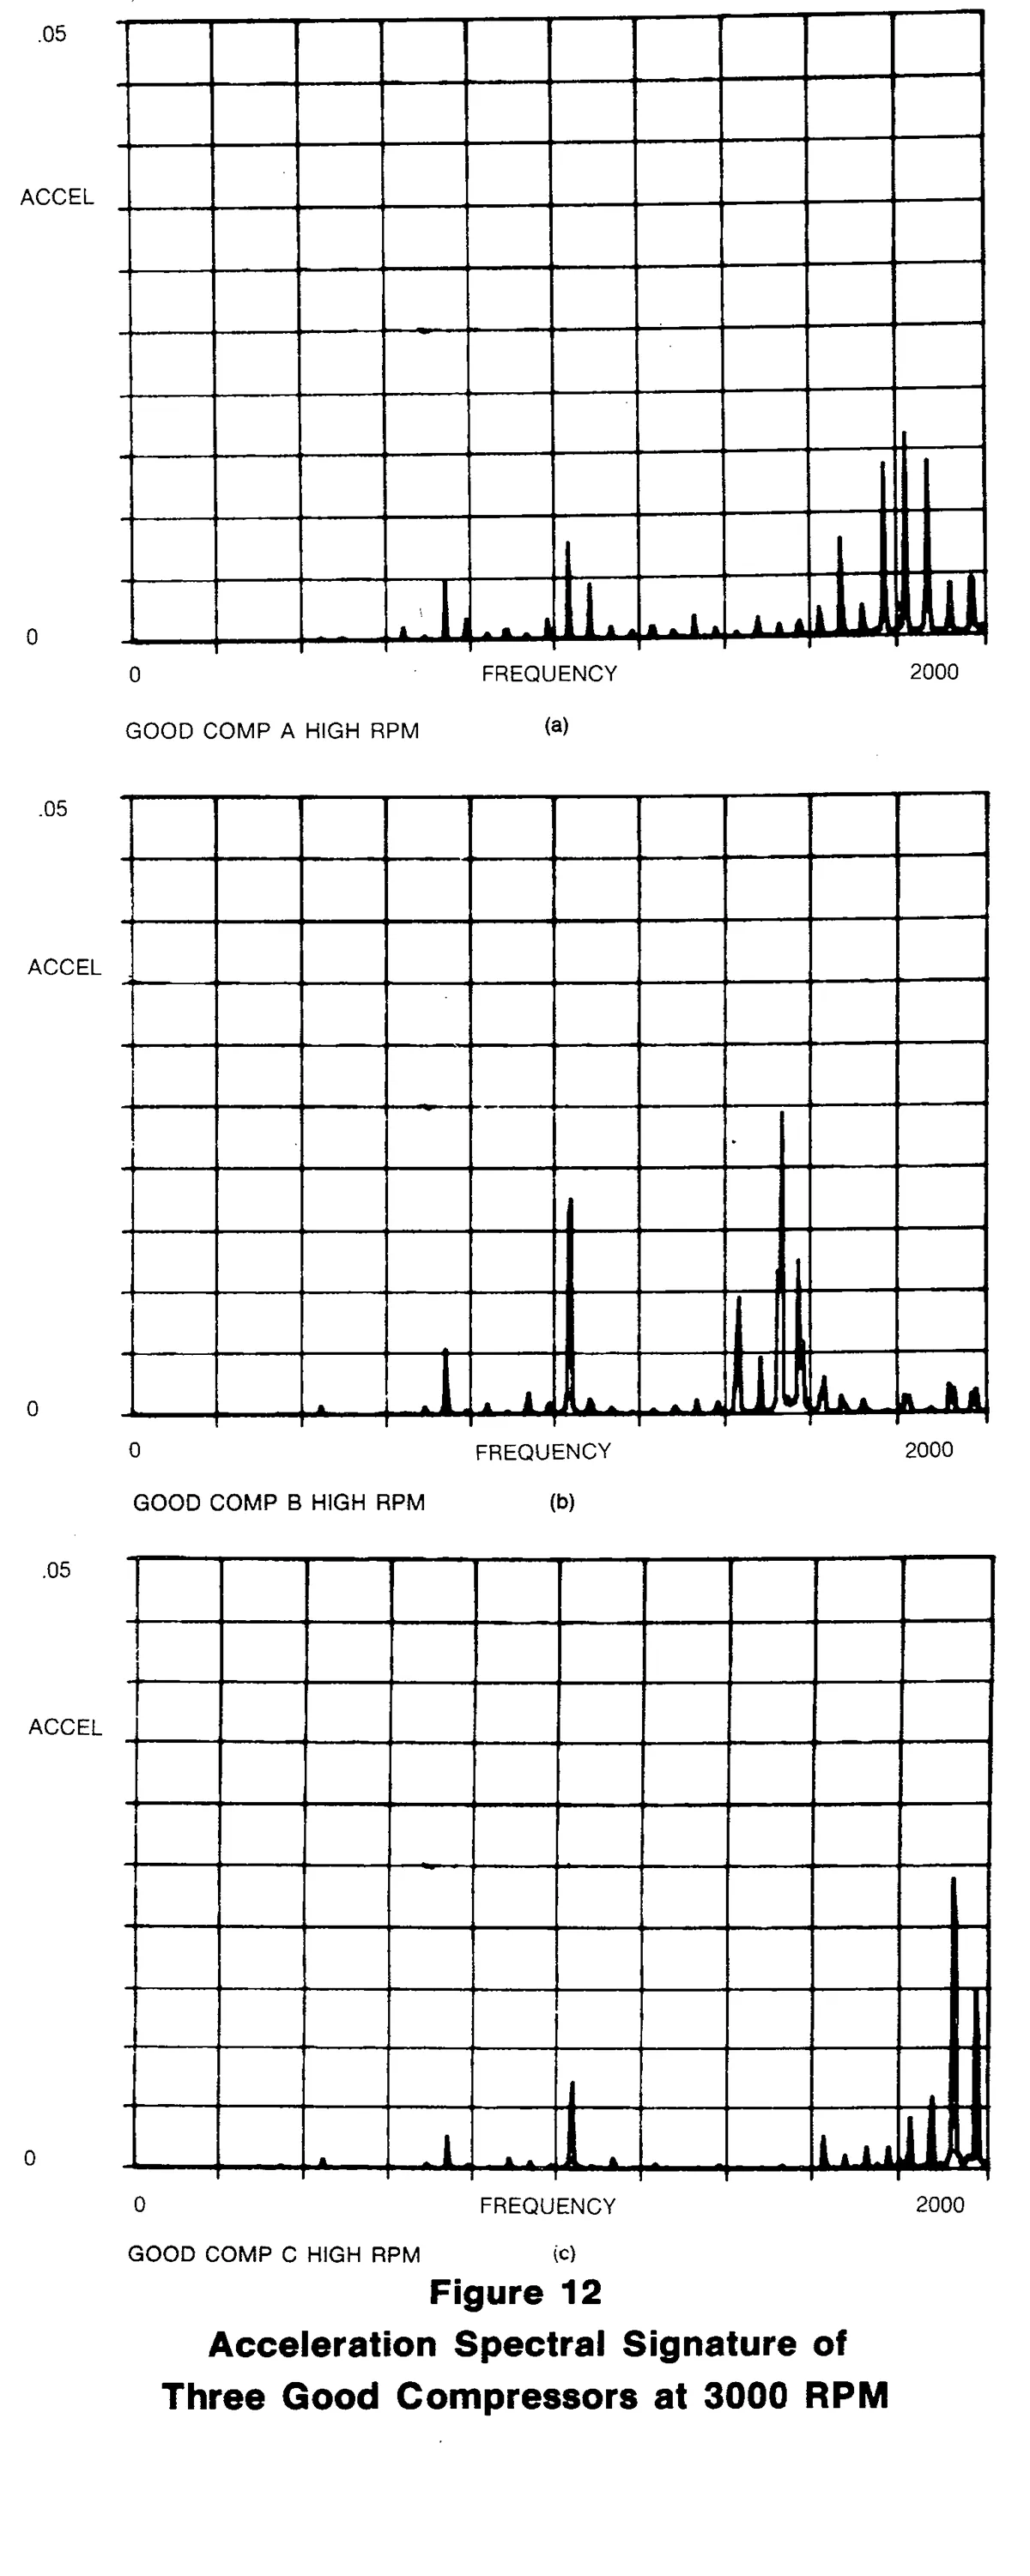
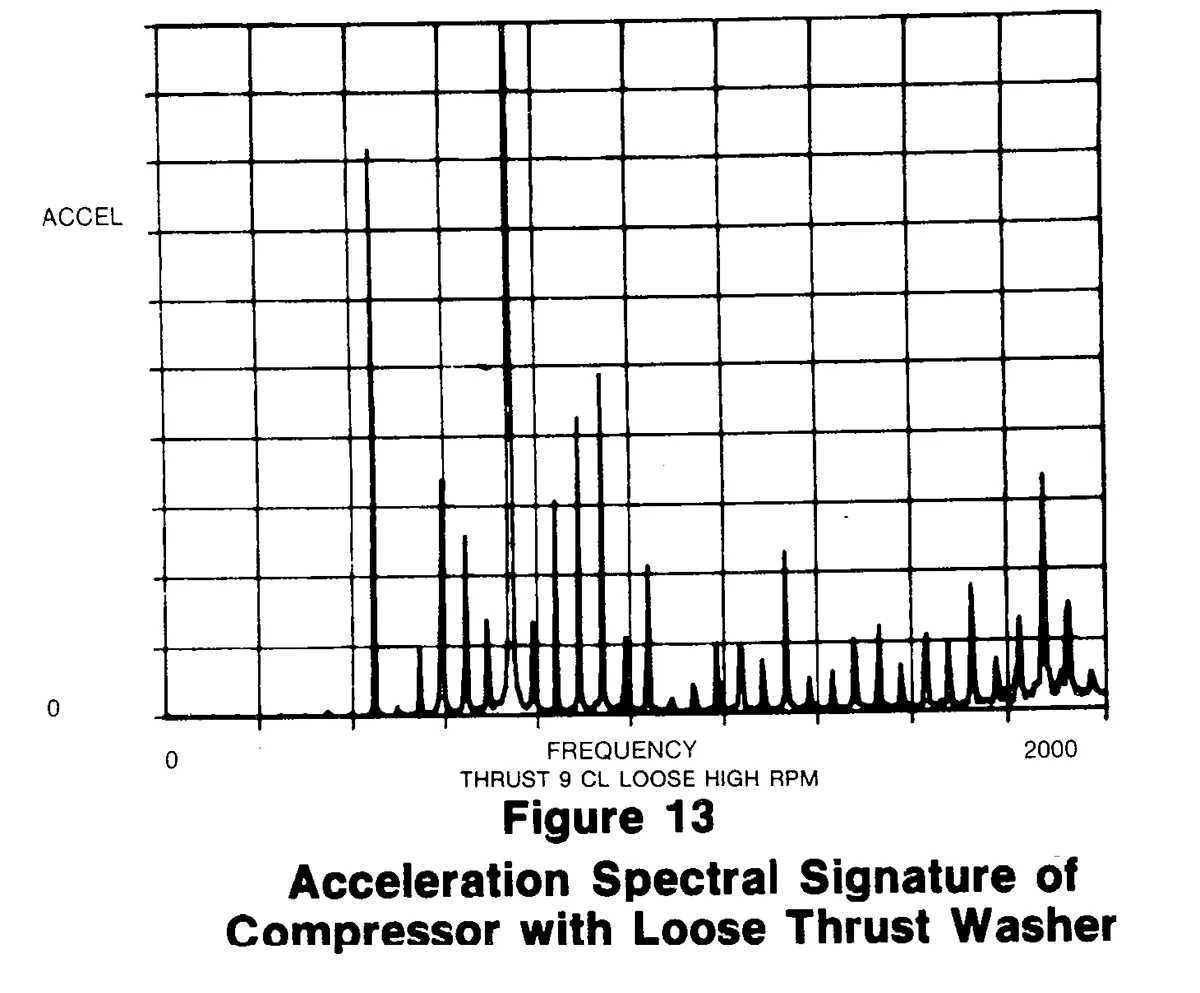
Figure 13 is the acceleration signature for the defective compressor above. Again, it appears quite different to the eye. In particular, the 15th harmonic exceeds the base-line by a factor of about 15 to 1.
Pressure Data
Figures 14(a), 14(b) and 14(c) are the 3000 RPM spectral signatures from pressure time histories. In this case, the major low frequency harmonic structure is at the 3rd, 6th and 9th orders. At higher frequencies, all integral multiples appear more distinctly. We note there is considerable consistency among these three spectral signatures.
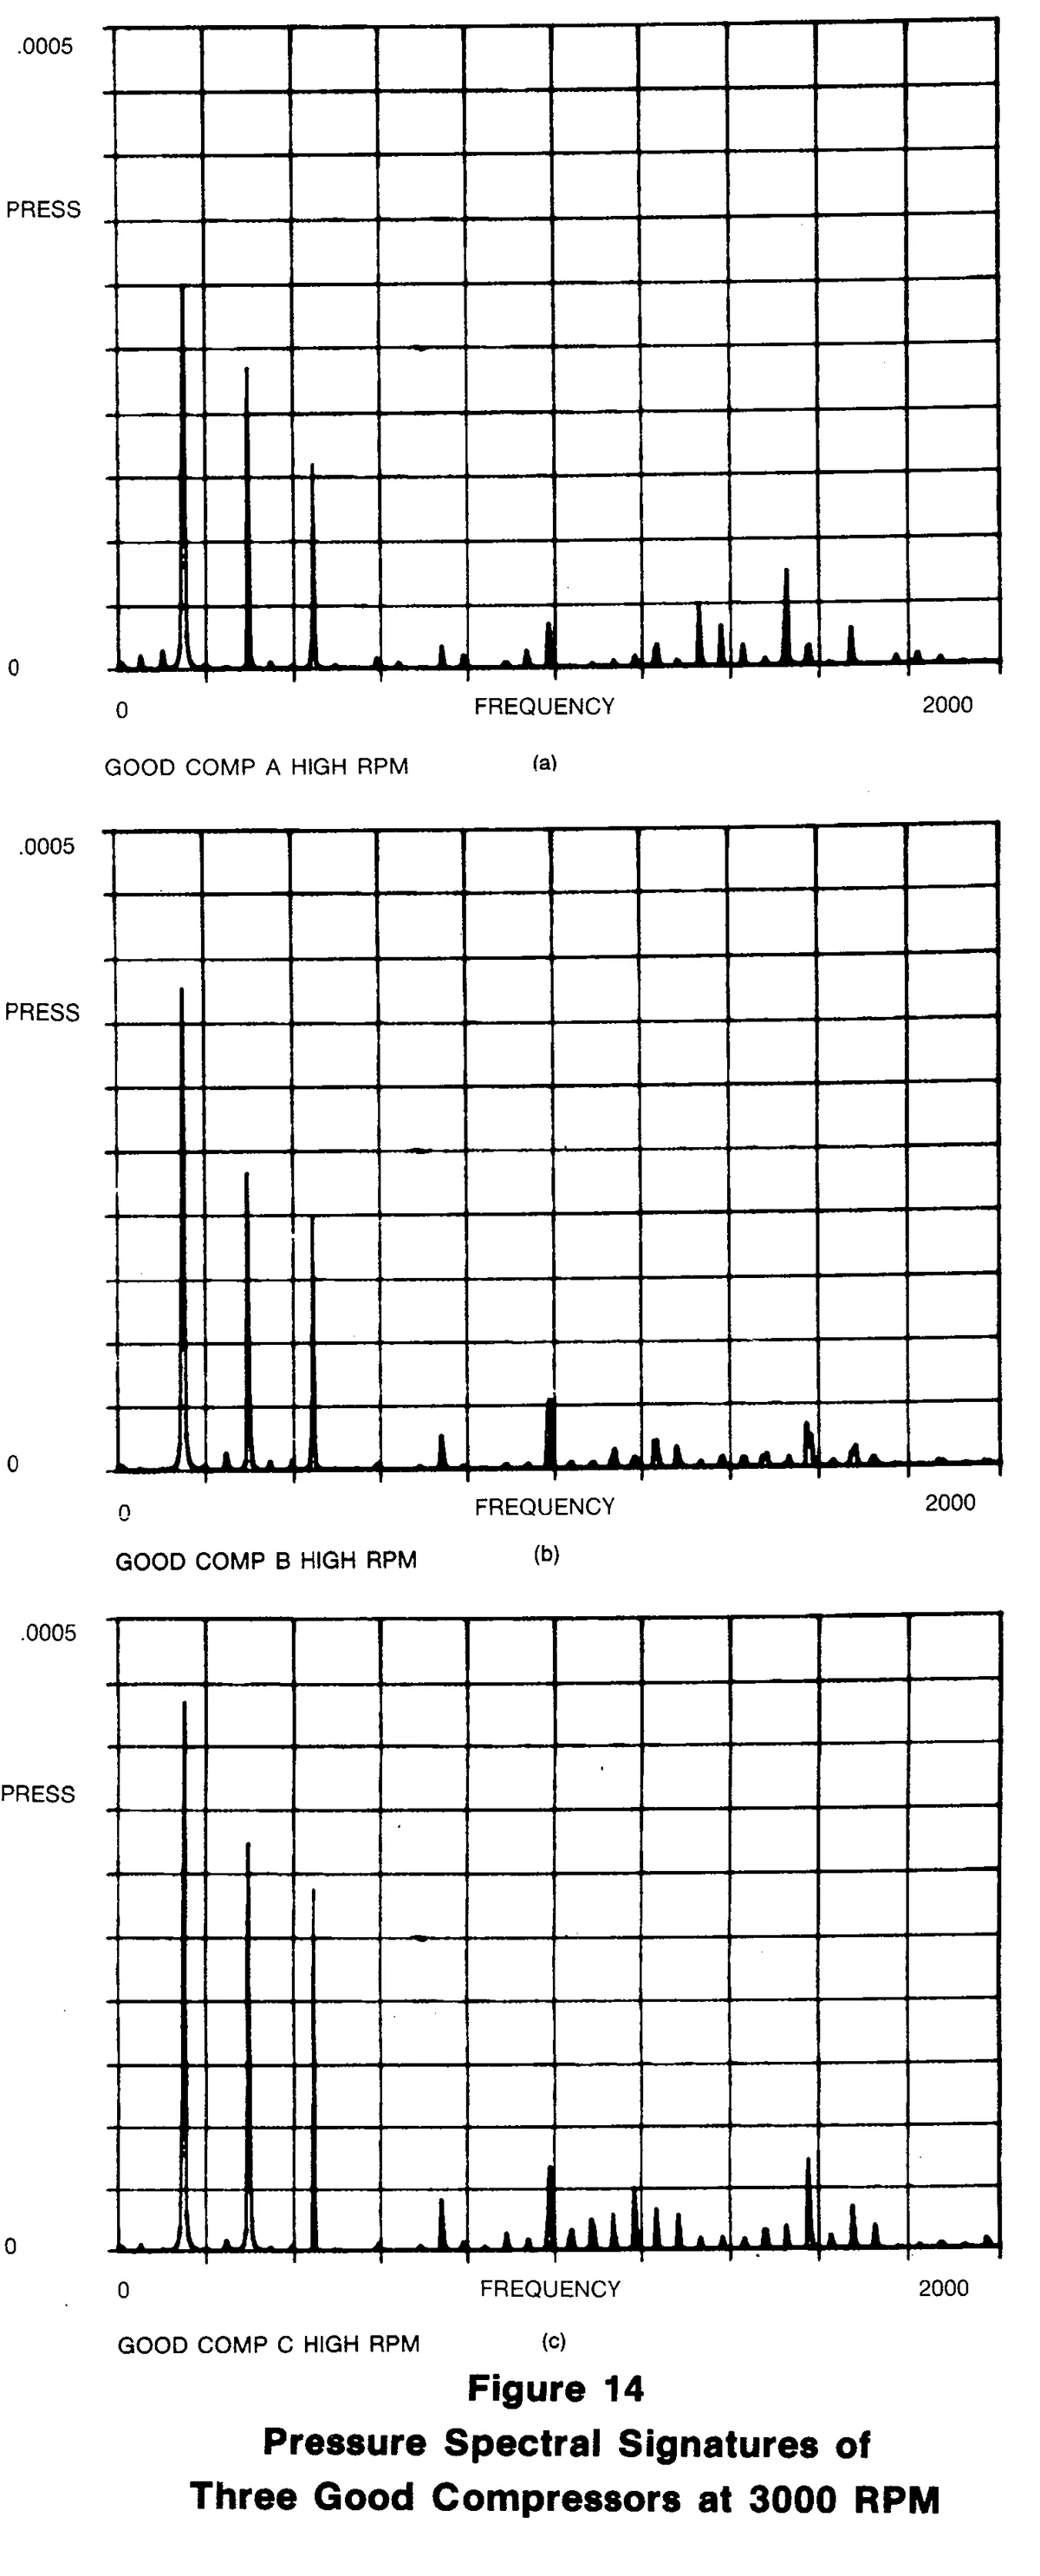
Figure 15 is the spectral signature for another defective compressor. In this case, a suction valve is missing. As in the previous case, the spectral signature is obviously different to the eye. Both the 3rd order and high frequency order amplitudes are generally increased. In particular the 3rd order amplitude is a factor of about 10 over the good compressor.
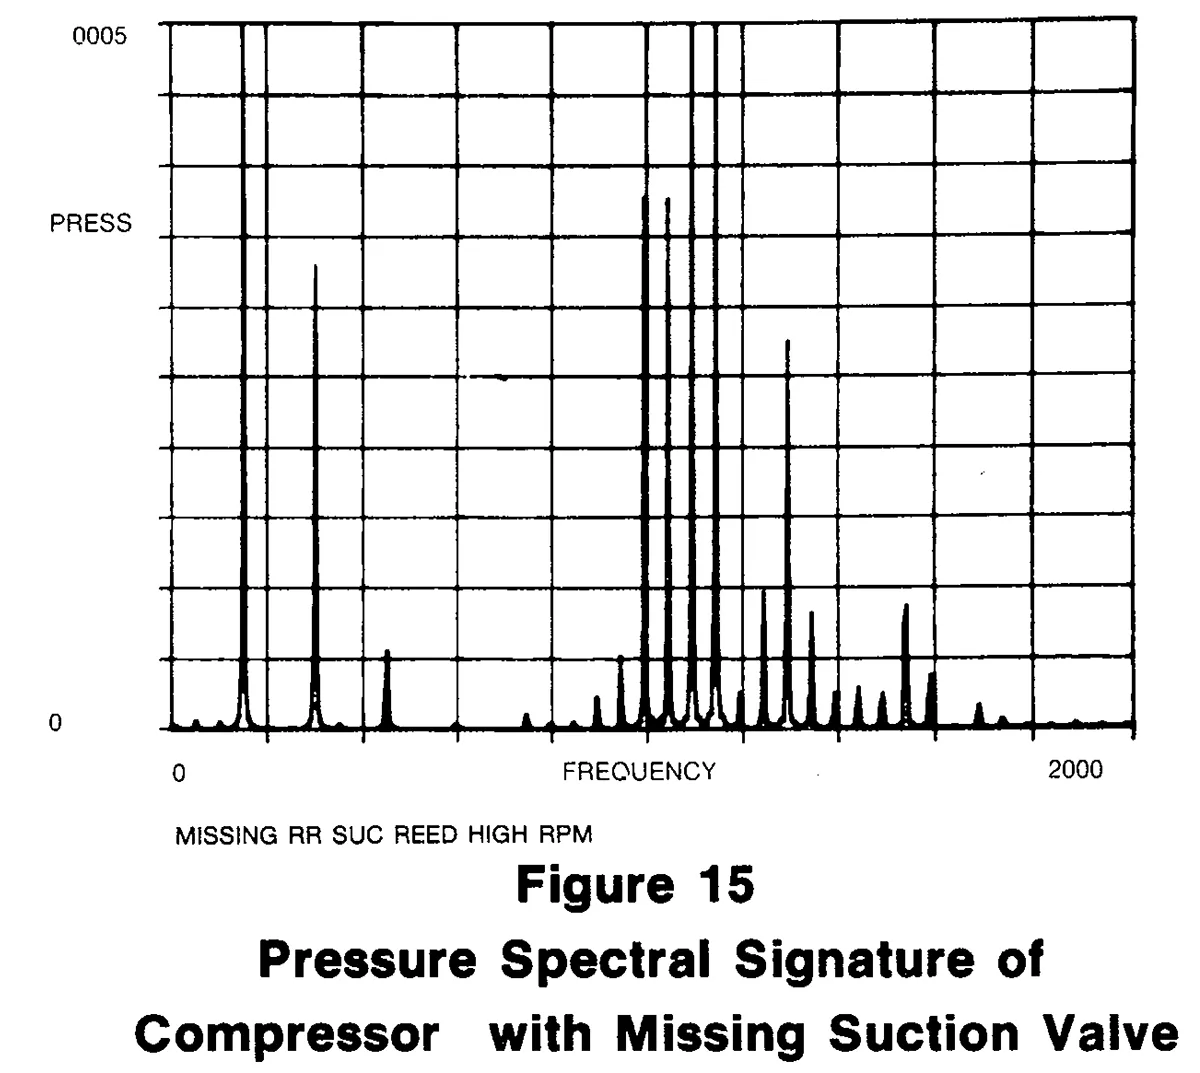
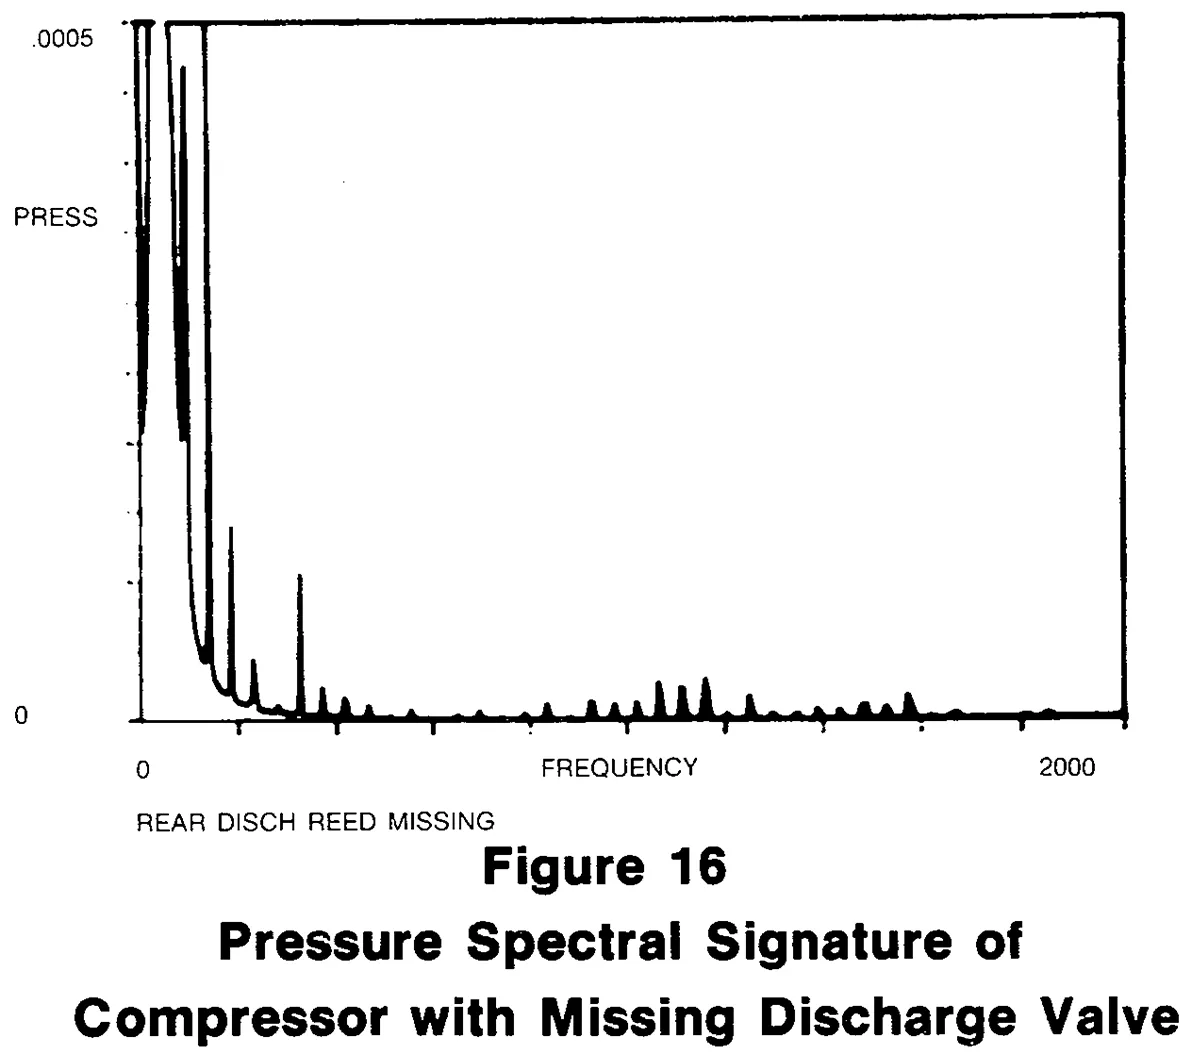
Figure 16 is the spectral signature of a compressor with a discharge valve missing. A first order harmonic appears in this case and goes completely off scale. Its amplitude in this case is a factor of 3000 greater than that of the good compressors.
In Figure 17(a) and 17(b) we have RPM spectral maps over low and high frequency bands; the first from 0-1000 Hz, the second from 800-1800 Hz. We can easily trace visually the orders in this frequency sweep. In each case the sweep is from about 1500 to 3000 RPM. This is the good compressor of Figure 14(a).
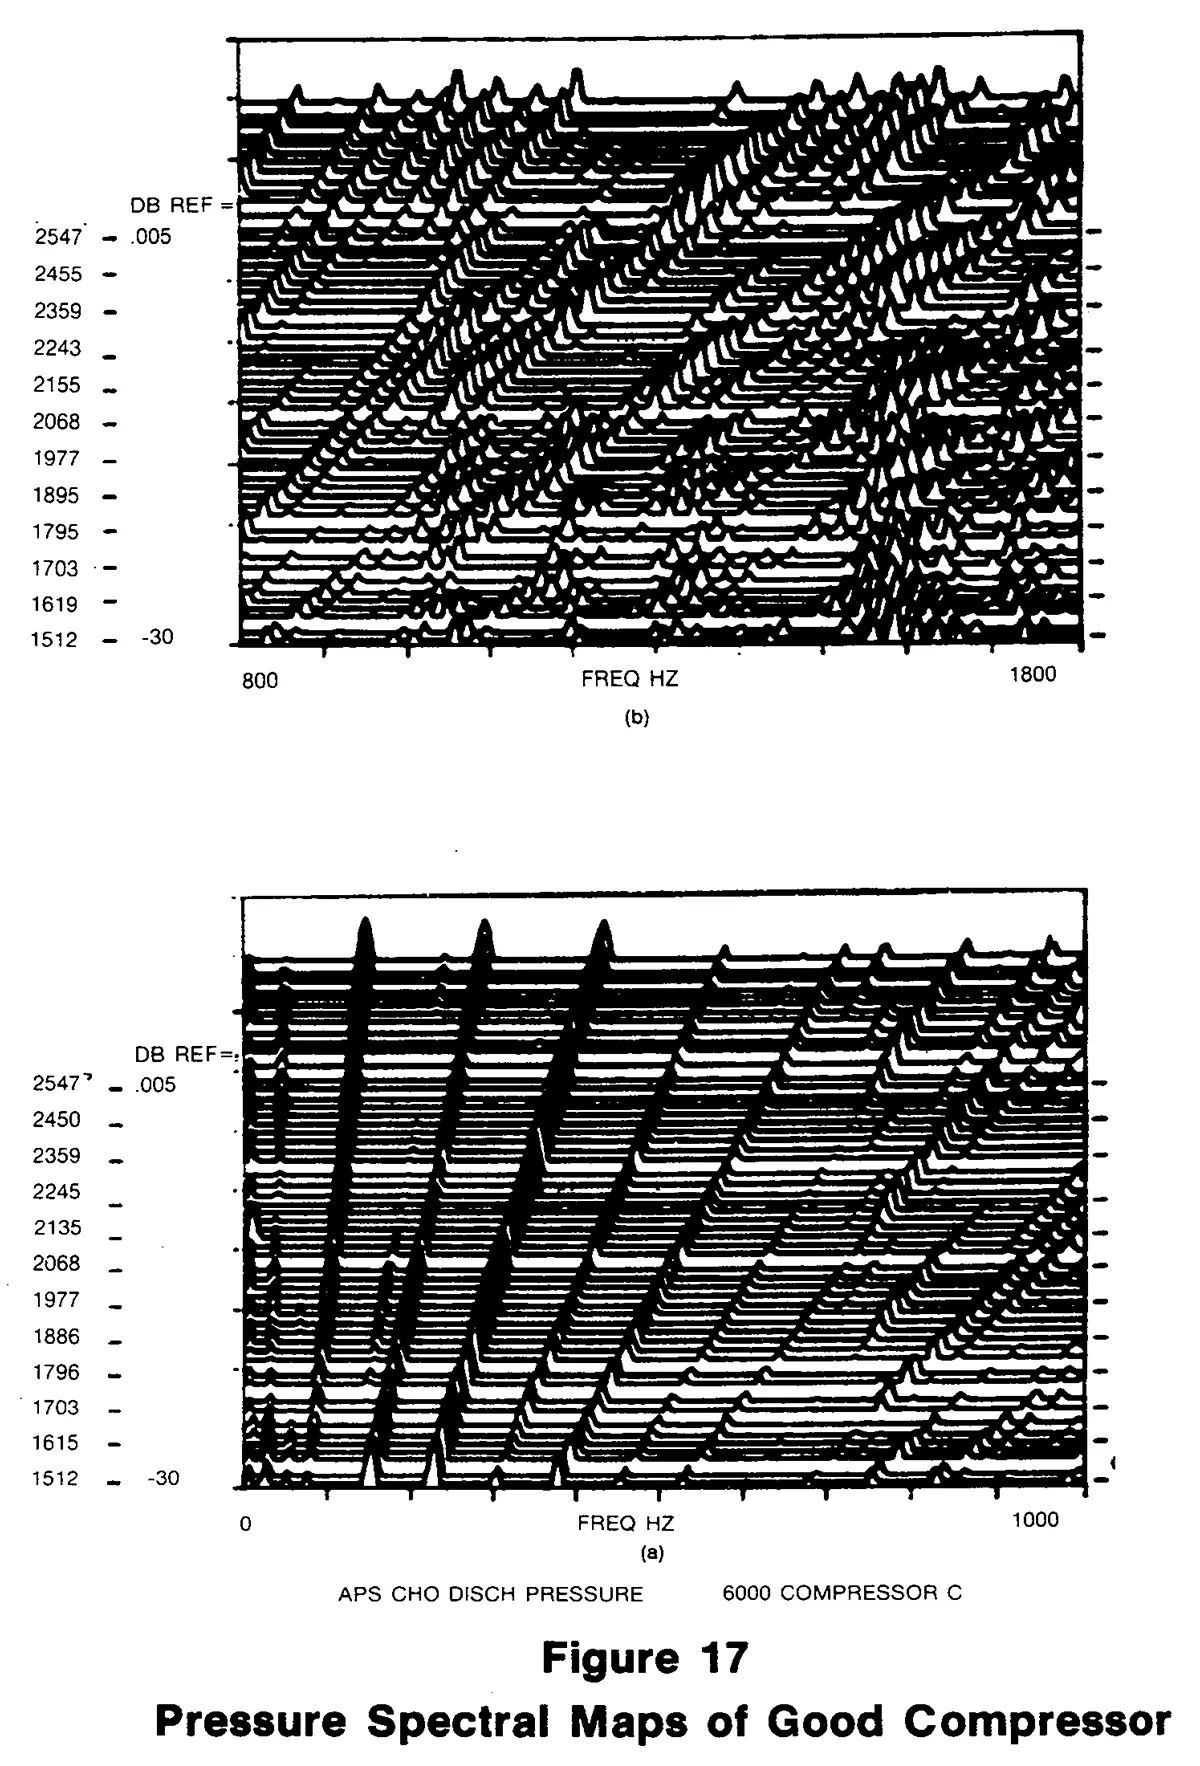
Figure 18(a) and 18(b) are spectral maps according to the same parameters as described in Figure 17. This is the same defective compressor whose 3000 RPM signature appears in Figure 15. The eye can easily detect features of this spectral map that differ substantially from the good spectral map signature. For example, the higher orders exhibit higher amplitudes in the 1000-1200 Hz frequency range. Hence, there is probably some sort of resonance in the flow system in this range. In addition, there appears to be a notch or attenuation effect around the area of 700-800 Hz.
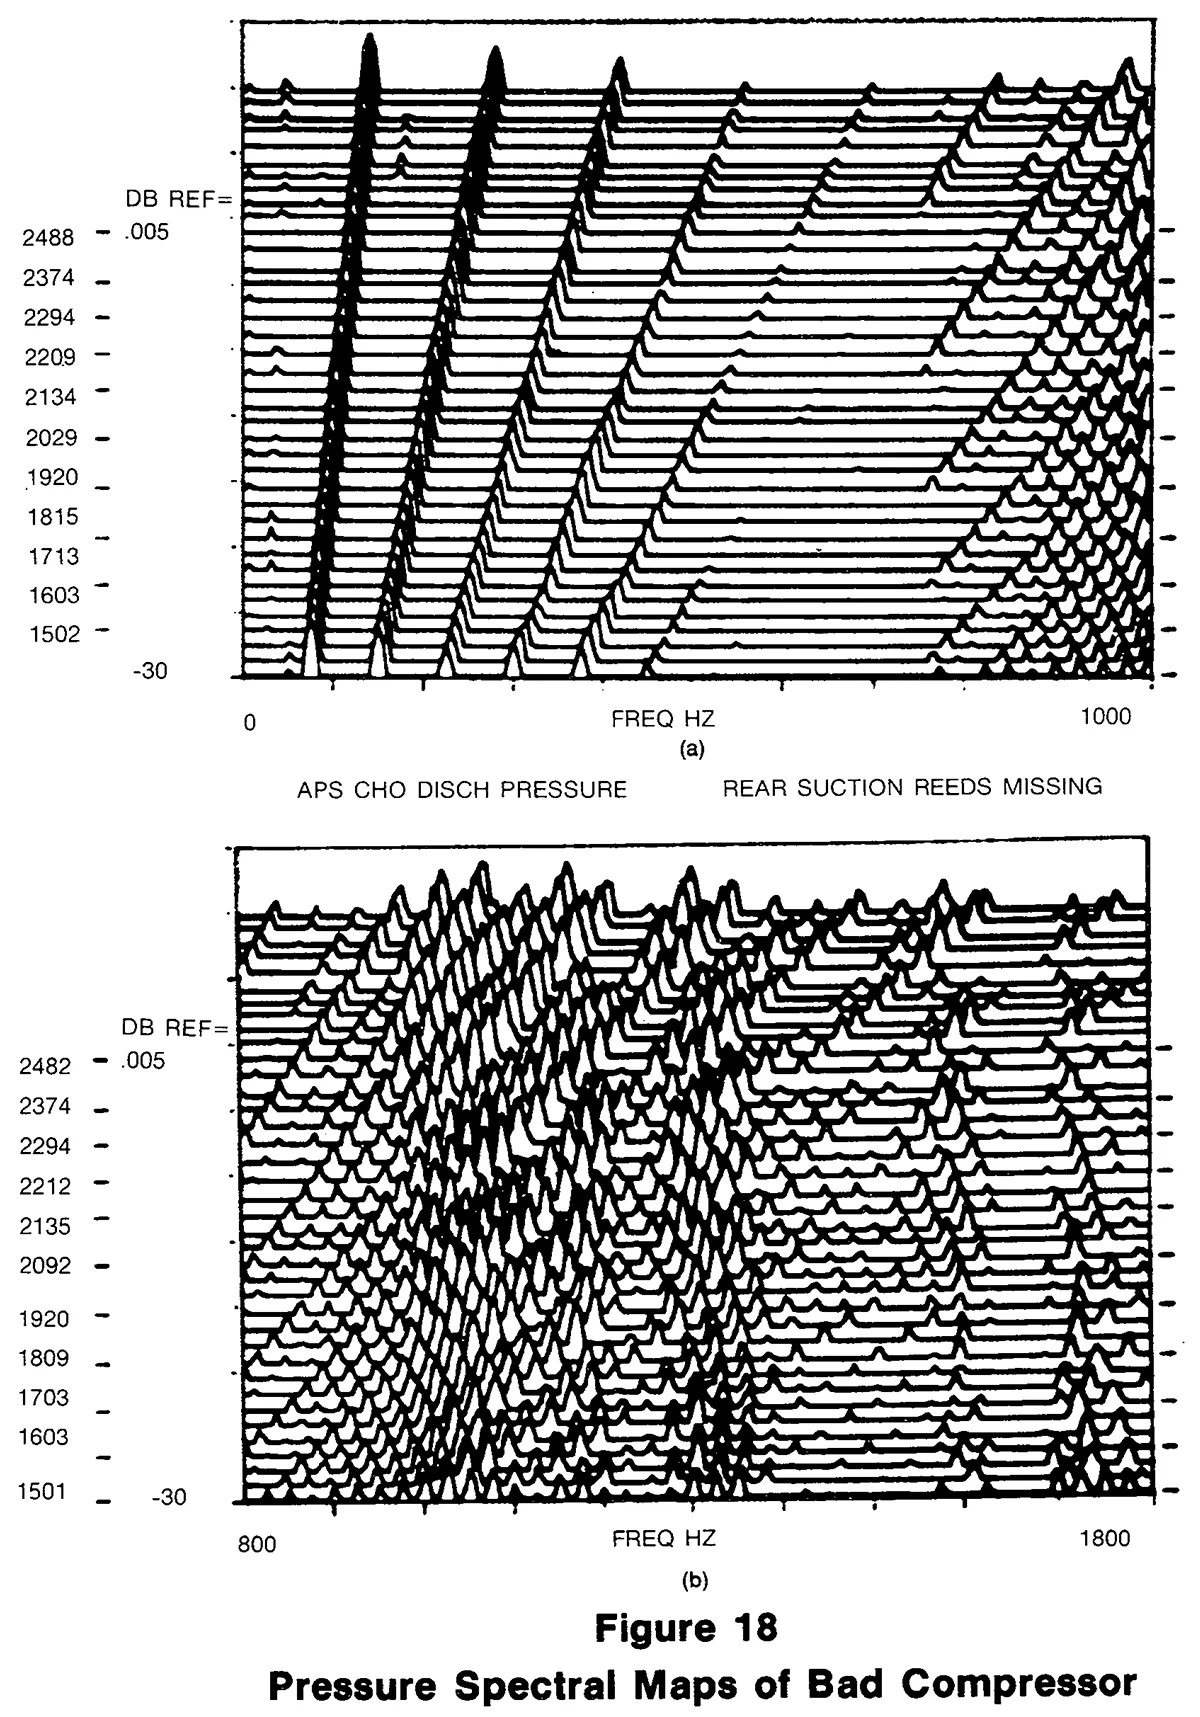
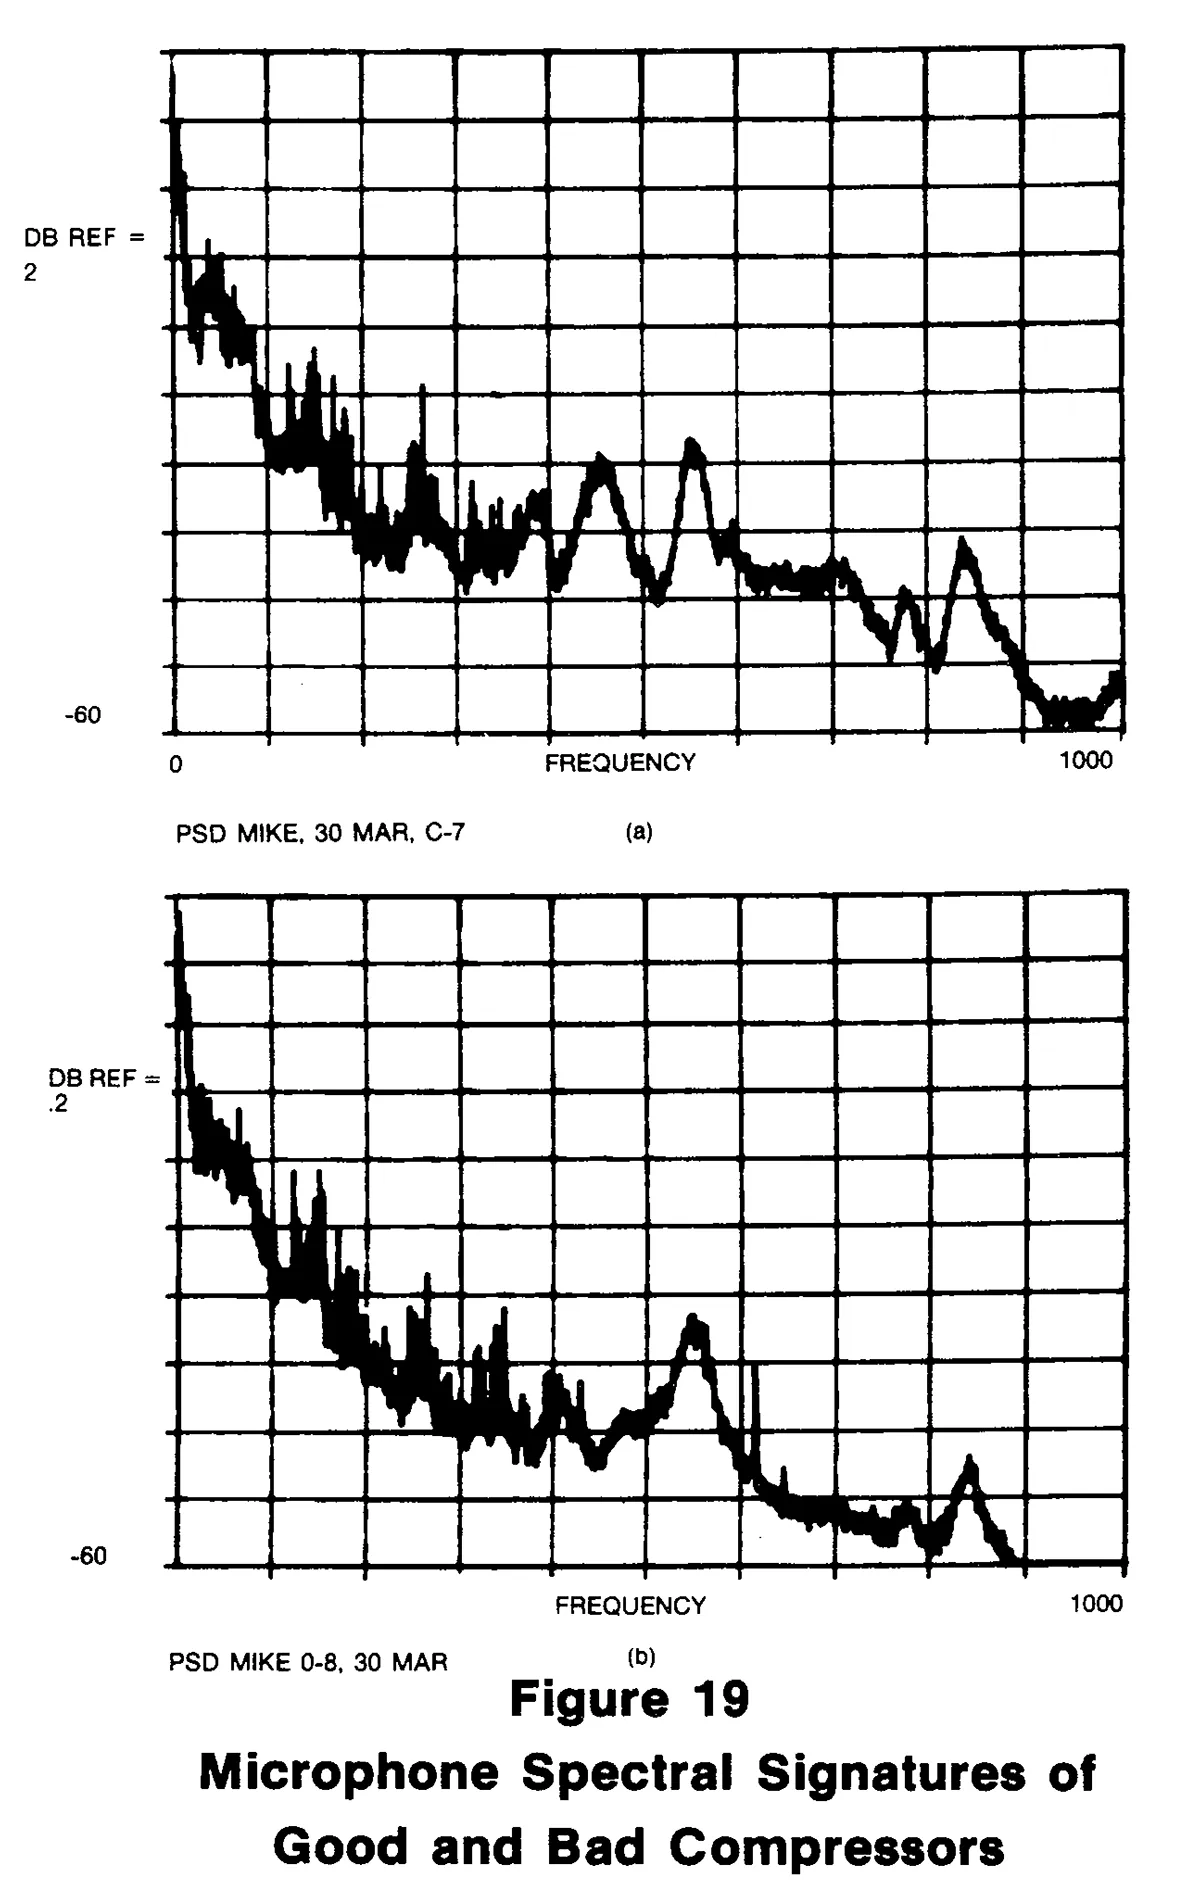
Figure 19(a) and 19(b) are plots of a good and bad compressor out to a higher frequency range. These plots are from 0-1000 Hz and the ordinate is on a log scale. The bad compressor in this case has a bad pulley bearing. This is a ball bearing with dents in the bearing race (brinelled). It is very difficult to predict the frequency phenomena you would expect to see. In Figure 19(b) though, we see a clear spectral peak from about 4200 Hz to 4800 Hz. This would likely be a good use for the Process Line bandpass filter option.
Although the eye can fairly easily see the differences in these RPM spectral maps, it could be difficult to automate this capability in a computer.
On the other hand, it is fairly easy to implement a detection and classification algorithm based on the single spectral signatures at 3000 RPM, as well as using a bandpass filter option to detect the brinelled bearing defects.
For example, Table 1 gives a summary of the harmonics and amplitudes that might be used to detect and classify the defective compressors discussed in this paper. First, a baseline signature would be developed based on a large number of good compressors. Then measured spectra would be compared with this good baseline signature and the characteristics of Table 1 used to detect and classify defects.
Characteristics of Signatures for Defective Items
| Defect Type | Relative Magnitude | Order No. | Instrument |
| 1. Loose thrust washer |
10-15 |
9th 15th |
Mike Accelerometer |
| 2. Missing rear suction valve | 10 20 |
3rd 21-24th |
Pressure Pressure |
| 3. Missing rear discharge valve | 3000 | 1st | Pressure |
| 4. Bad pulley bearing | Increased Energy | 4200-4800 Hz | Mike |
This table shows a method by which spectral signature analysis techniques could be automatically employed for defect detection. The availability of Process Lines in RMA further facilitates automated signature detection providing both alarm and abort capabilities upon detection.
